Diffusion via Dialysis

In this lab, we studied the diffusion of substances through a semi-permeable membrane. We found that smaller molecules like iodine and glucose were able to pass through the dialysis tubing, while larger starch molecules did not diffuse through the membrane. The pore size determined which molecules passed through the membrane. A similar phenomenon is seen in cell membranes, as the phospholipid bilayer also acts as a semi-permeable membrane that limits the passage of certain molecules into and out of the cell.

This experiment allowed me to visualize the diffusion of iodine, glucose, and starch through dialysis tubing. Diffusion is the process by which material moves from regions of higher concentration to areas of lower concentration. Diffusion is important to living cells, as it is one mechanism for moving substances into or out of the cell through the phospholipid bilayer. Diffusion is also used by physicians to treat kidney failure with dialysis.

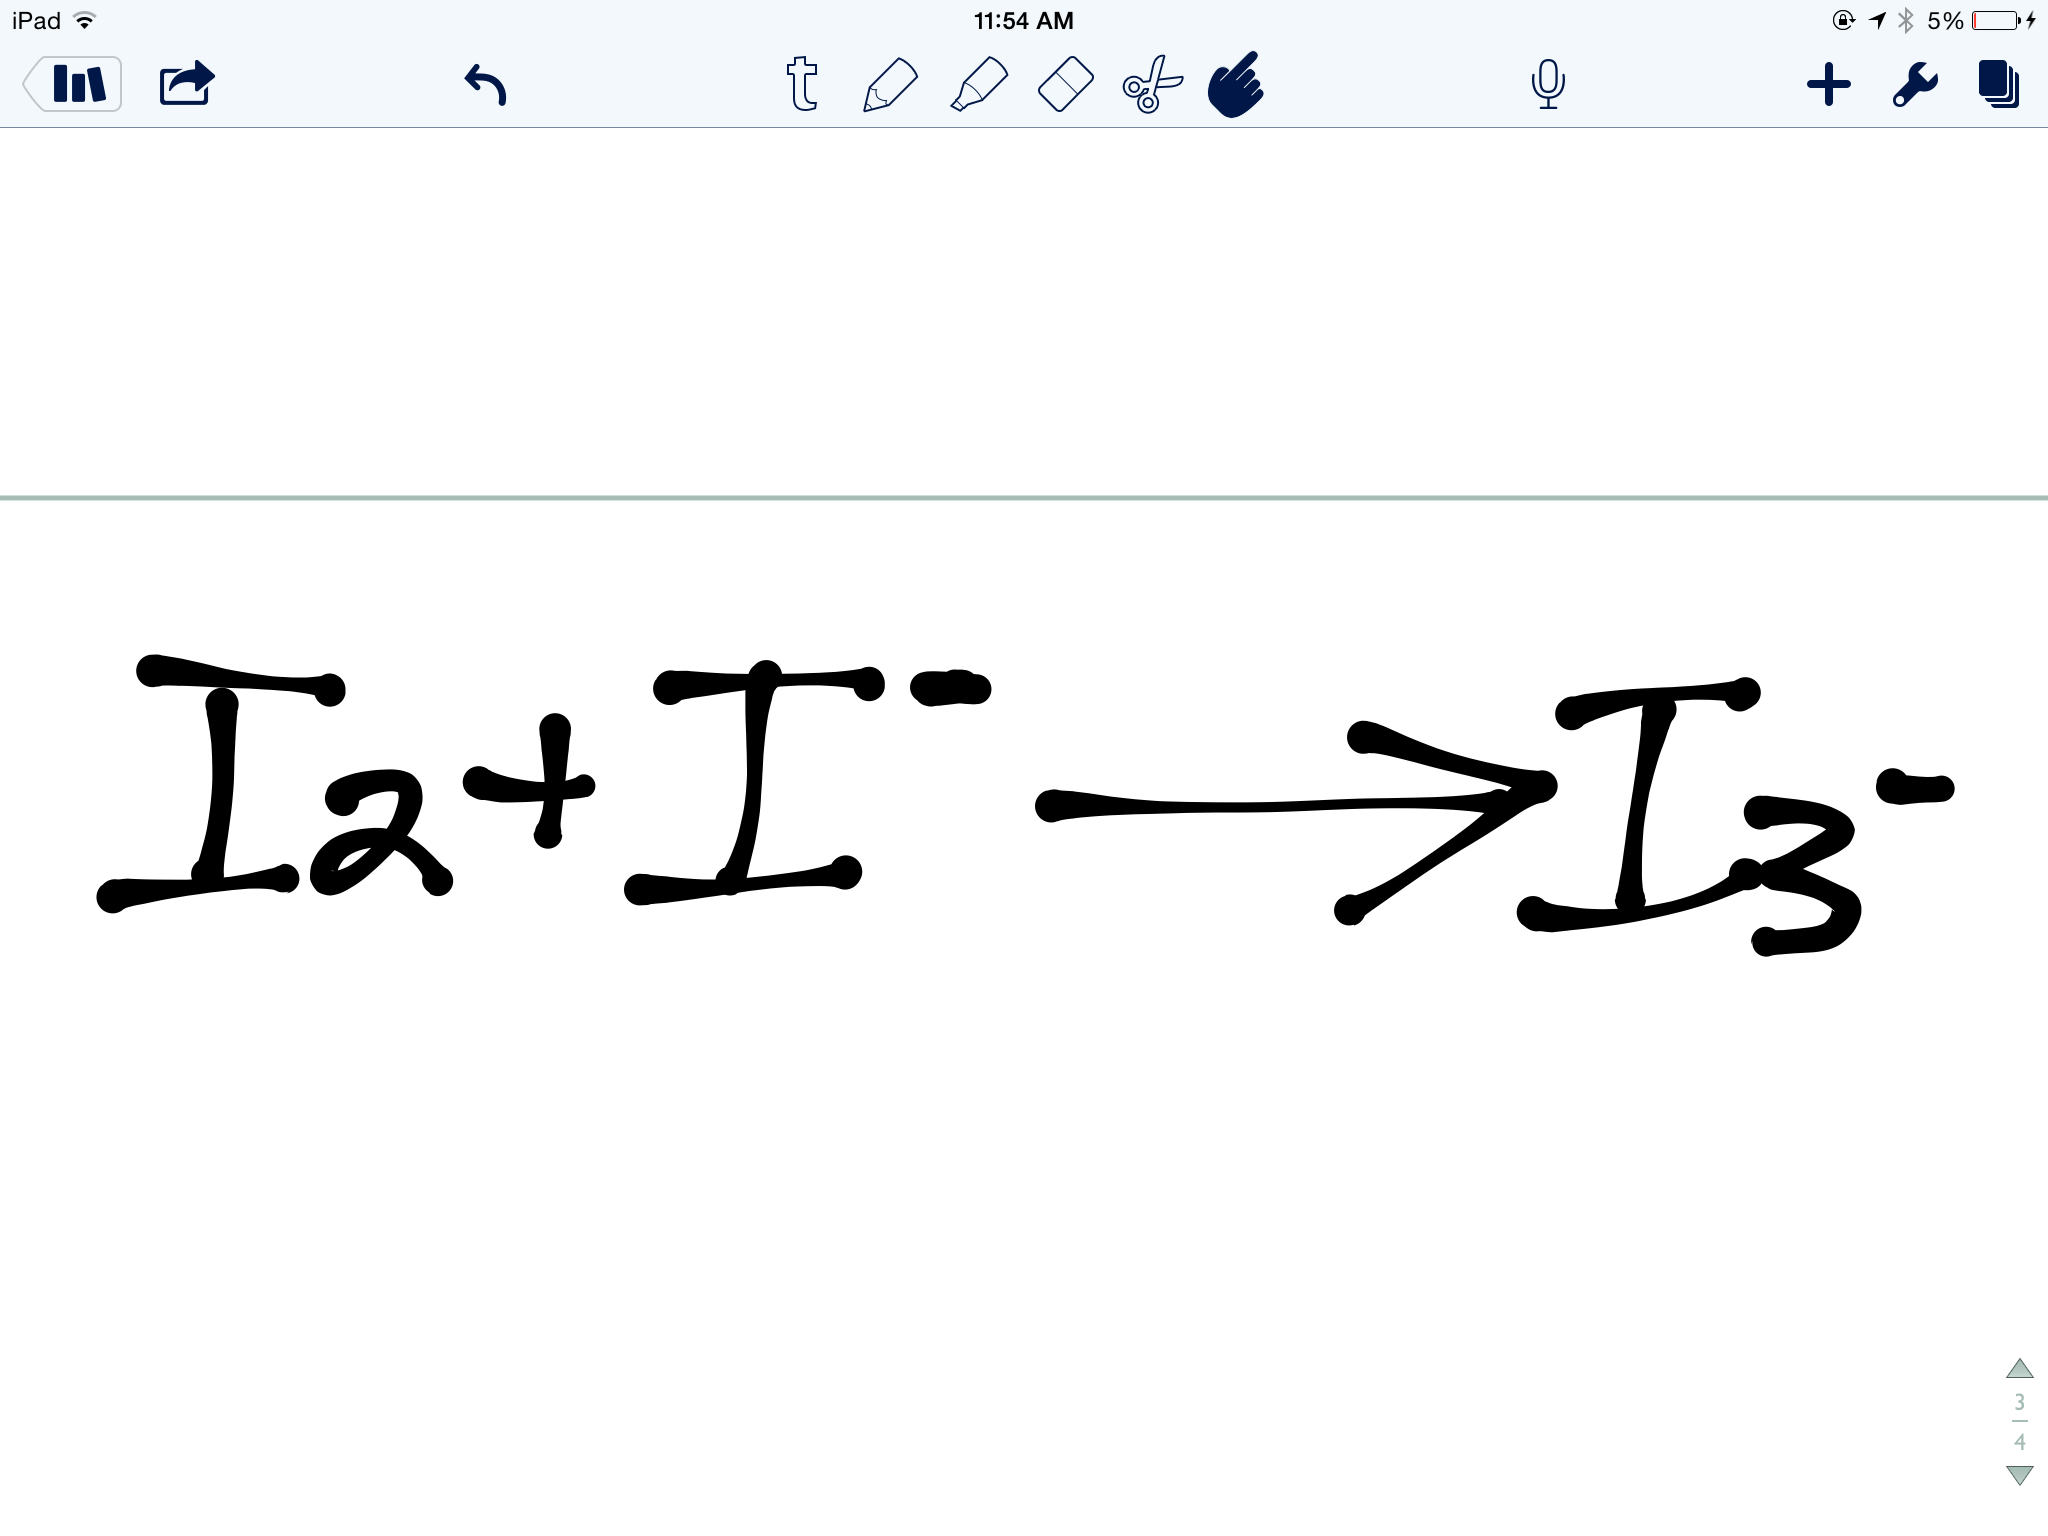
We used Lugol’s iodine in the experiment for three reasons: it is colored, so it is visible to the naked eye; its molecules are small in size, which allows them to pass through the membrane; and molecular iodine is not soluble in water, but it forms a triiodide molecule (and becomes water soluble) when potassium iodide is added.

Formation of a triiodide:

IMG_0280.PNG

We used glucose because it is a small molecule and it is easy to measure it in solution with a glucose strip. In addition, we used starch because it is a large molecule and reacts with Lugol’s iodine to cause a color change.

We used the following materials to demonstrate diffusion through a dialysis membrane:
-2 250ml beakers
-2 15cm pieces of dialysis tubing
-Glucose test strips
-Solution of Lugol’s iodine in a dropper bottle
-15ml glucose solution
-15 ml soluble starch solution
-distilled water

Preparation of the starch beaker:
1. I poured enough distilled water (about 125ml) to fill half of the beaker.
2. I tied off one end of a piece of dialysis tubing and added the starch solution.
3. I tied off the other end of the tubing and rinsed the outside with water.
4. I placed the tubing into the beaker of distilled water.
5. I added enough Lugol’s iodine to change the color of the water (20 drops).
6. I waited 20 minutes before recording my results.

Preparation of the glucose beaker:
1. I poured enough distilled water (about 125ml) to fill half of the beaker.
2. I tied off one end of a piece of dialysis tubing and added the glucose solution.
3. I tied off the other end and rinsed the tubing as discussed above.
4. I placed the tubing into the beaker of distilled water.
5. I recorded the results 20 minutes later.

Testing the solutions:
1. In the presence of starch, the Lugol’s iodine will change the solution into a deep blue or black color.
2. In the presence of glucose, a glucose test strip will change color when it is placed into the solution.

Diffusion of Lugol’s iodine and starch:
Figure 1

IMG_0281.PNG
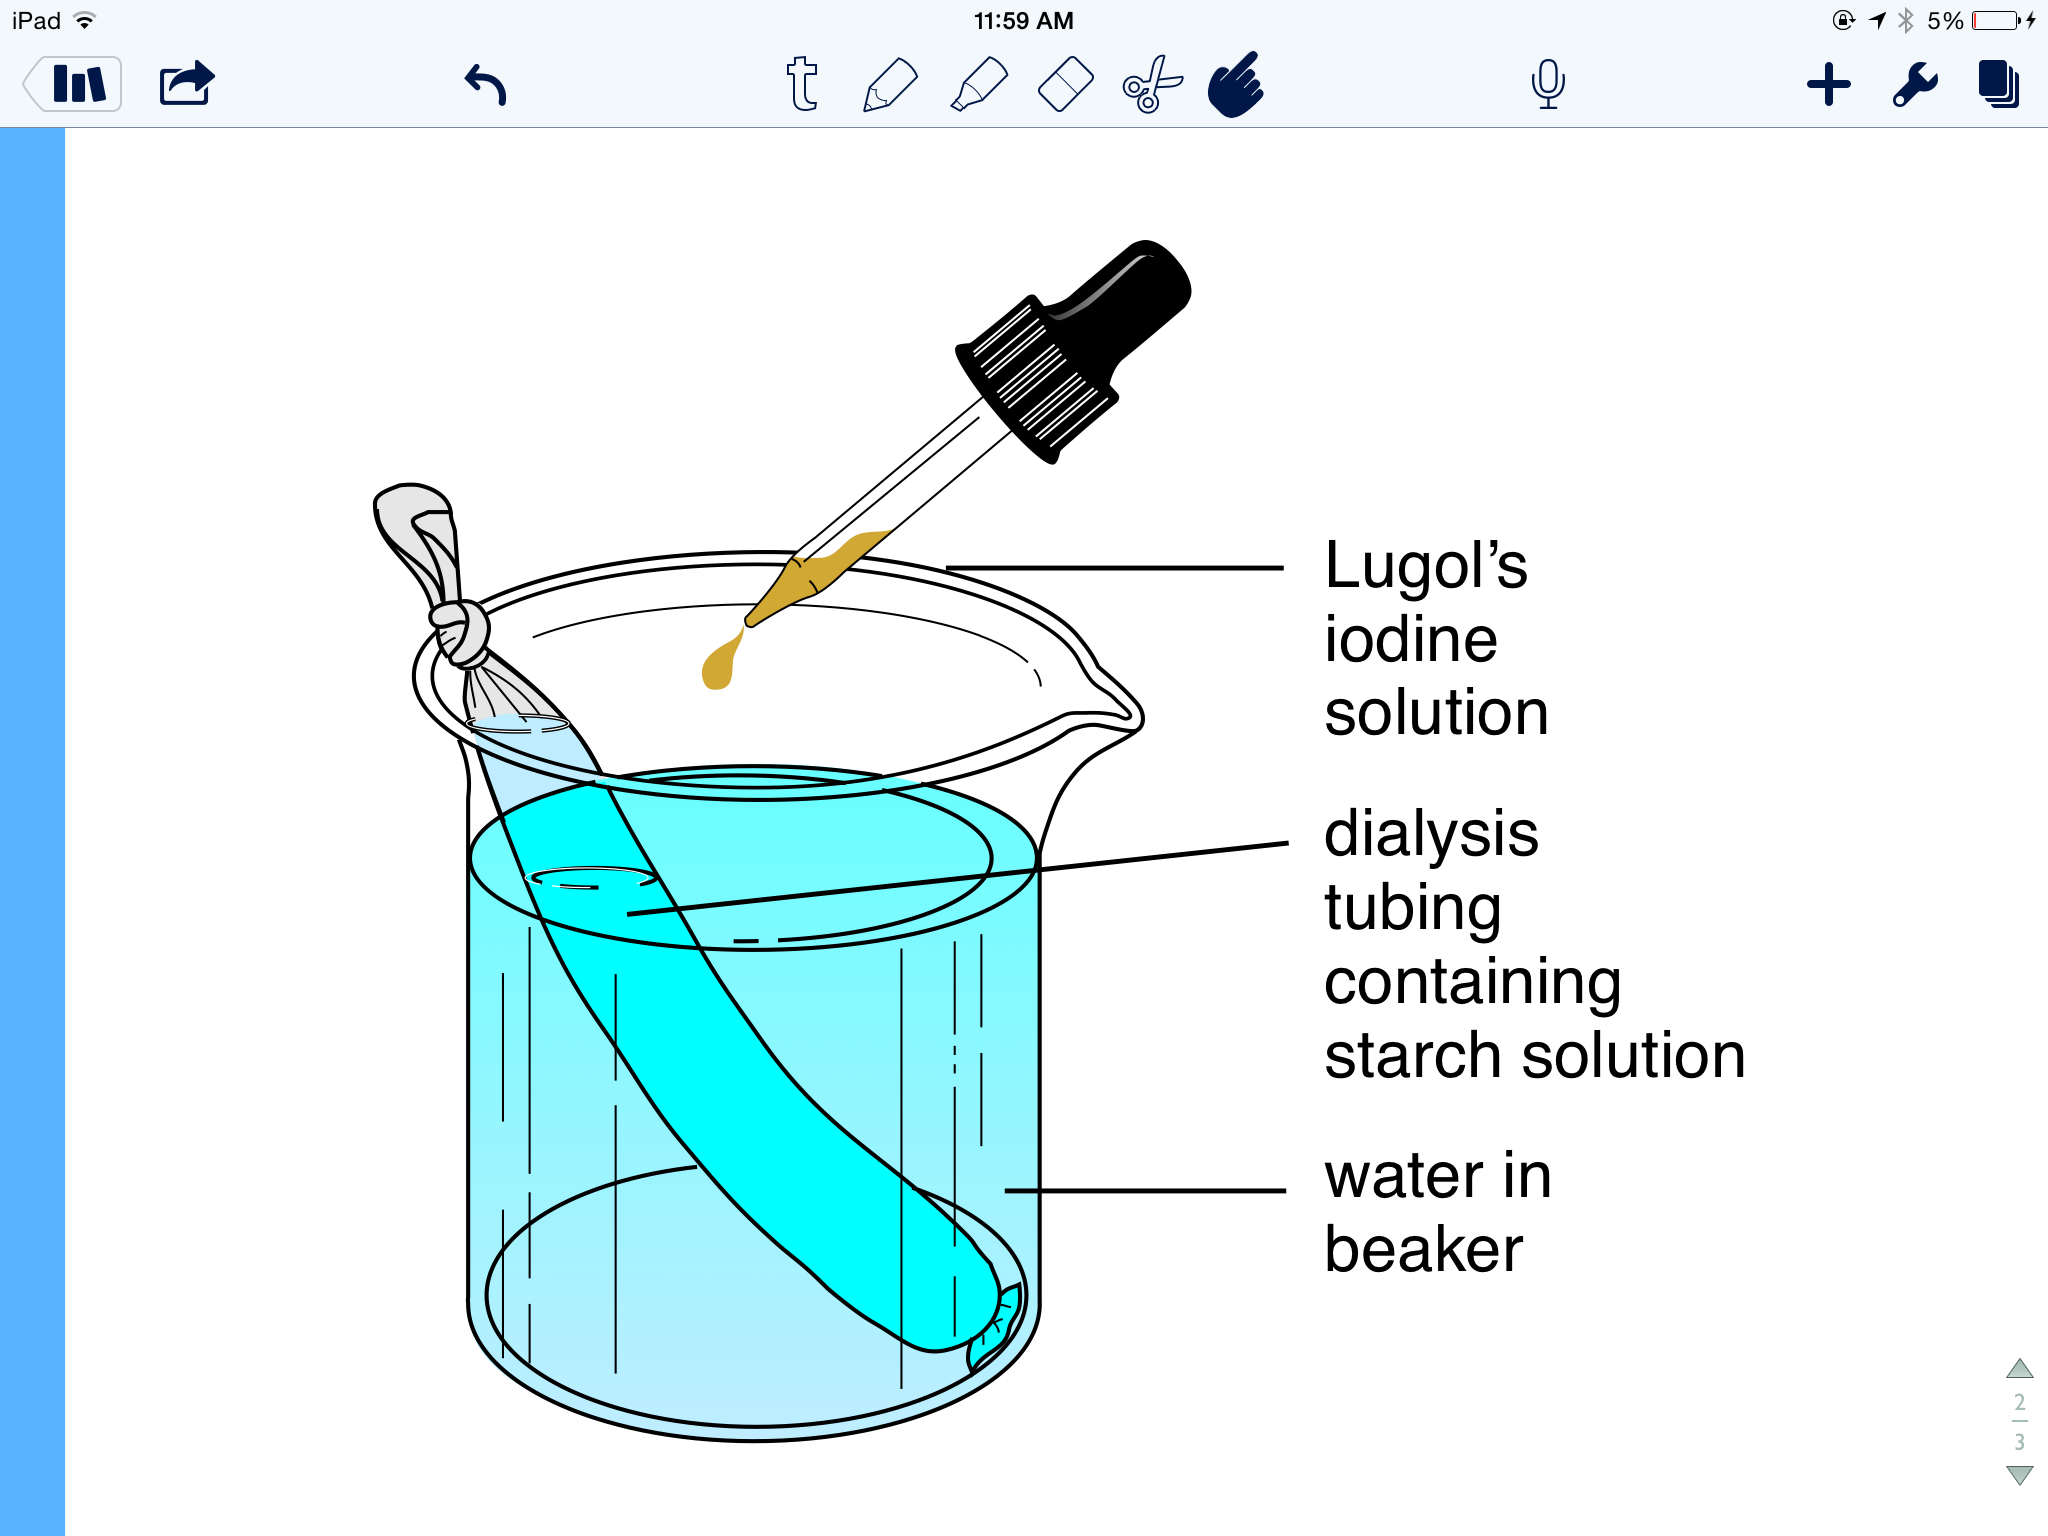
Figure 1 illustrates the assessment of starch and iodine diffusion through a semi-permeable membrane.

Figure 2

IMG_0251.JPG

Figure 2 illustrates the addition of iodine to the beaker, which made the distilled water turn a light shade of yellow. The starch solution is inside the dialysis tubing.

Figure 3

IMG_0232.JPG

Figure 3 illustrates the iodine/starch experiment during monitoring to detect a color change.

Figure 4

IMG_0277.JPG
Figure 4 illustrates the iodine-starch beaker after twenty minutes. The iodine has diffused into the dialysis tubing and reacted with the starch, which has changed the solution color to blue. It is apparent that the starch did not diffuse through the semi-permeable dialysis tubing, as the color of the solution outside the tubing remains yellow.

Diffusion of glucose:
Figure 5

IMG_0268.JPG

Figure 5 illustrates the assessment of glucose diffusion through a semi-permeable membrane.

Figure 6

IMG_0264.JPG

Figure 6 illustrates the glucose diffusion experiment during monitoring for twenty minutes.

Figure 7

IMG_0272.JPG

Figure 7 illustrates Mr. Wong testing the glucose solution with test strips.

Figure 8

IMG_0276.JPG

Figure 8 depicts the test strip for our beaker on the right with a distilled water control on the left. The test strip turned yellow, consistent with the presence of glucose, which showed that it diffused through the semi-permeable membrane of the tubing.

In this experiment, I explored the effect of molecule size on diffusion using a selectively permeable membrane. This process is comparable to diffusion through cell membranes, which regulates the substances that enter and exit the cell. Diffusion is caused by the random movement of molecules, and results in substances moving from regions of higher concentration to those of lower concentration.

Lugol’s iodine, which is molecular iodine combined with potassium iodide, was used in the experiment. Molecular iodine is insoluble in water, but mixing it with potassium iodide forms I3-, which is soluble in water. The chemical equation for this reaction is: I2 + I- ——> I3-

*Initially, enough Lugol’s iodine was added to the water in beaker A to give the water a yellow hue. The triiodide diffused through the semipermeable membrane and turned the soluble starch solution blue. The color change occurred because the triiodide slipped into the beta amylose coils of the starch (see Figure 9). Perhaps if the experiment were continued for a longer duration, this binding would remove the iodine ions from solution and make the solution outside the beaker lighter.
Figure 9

IMG_0282.PNG

*The chemical test for glucose demonstrated that the glucose molecules in the dialysis tubing of beaker B diffused through the semipermeable membrane. This was confirmed by testing distilled water as a negative control, which did not change the test strip. In contrast, glucose solution was used as a positive control and changed the test strip color.

*Although we did not let the beaker sit overnight, and the only substance that we showed to diffuse is glucose, I hypothesize that water would pass through the membrane by the process of osmosis. Osmosis is the movement of water through a semipermeable membrane to form an equal water molecule concentration on both sides of the membrane.

* The starch did not pass through the membrane. This was shown when the solution inside the tubing turned blue after iodine was added due to the reaction between triiodide and starch. The solution outside the tubing remained the yellow color of the iodine, which indicated that the starch did not diffuse outside the tube. This is because the large size of the starch molecules did not permit diffusion through the dialysis membrane.

* I hypothesize that the pore diameter of the dialysis membrane is between the size of a glucose molecule and a starch molecule. This is because the glucose, iodine, and water all passed through the membrane, but the starch remained inside the tubing.

* I assume that the pore diameter of the tubing is between the size of the starch and glucose molecules. Furthermore, the pore diameter did not change, and the molecules diffused based only on size, and not because of polarity or charge.

If I were to repeat this experiment, I would make sure to clearly mark the beakers. My group accidentally placed iodine in both solutions, but we luckily caught our mistake and corrected it promptly. In addition, I would try different dialysis tubing with varied pore diameter to determine the relative size of glucose, starch, and iodine molecules. Furthermore, I would like to test other substances, including lipids and proteins, in place of starch. Finally, I would like to create an experimental membrane with an active transport mechanism in order to visualize the process of active transport, in contrast to diffusion and osmosis.

Chemwiki.ucdavis.edu

Exploration for a Microscope Lab

In this lab, we studied the uses of the compound light microscope by analyzing hair, string, magazine print, and a ruler with the microscope and with the naked eye. The purpose of this lab was to explore visualization of common items with the microscope. The microscope is capable of enlarging objects by factors of 10, allowing for details that are invisible to the naked eye to become apparent. While completing this lab, we learned about the parts of a microscope and their functions, the process of making a wet slide, and the change in orientation of an image when viewed in a microscope.
As the human eye cannot distinguish objects smaller than 0.1 millimeters, the microscope is a helpful tool for magnifying specimens. There are two common types of microscopes: light and electron. Light microscopes use light waves to illuminate the object being examined, while electron microscopes use a series of electrons to visualize the object. I used a light microscopes, which is often used for general laboratory work, to magnify hair, string, magazine print, and a ruler. Light microscopes can magnify objects from 40 to 1000 times, but we only measured data at 40X and 100X. The specimens were prepared on a slide using the wet mount method, which is the most frequently used form of slide preparation. Below is a diagram of how light travels in a light microscope from the specimen being examined to the eye.

IMG_0221.PNG
For this lab we examined the following items:
-magazine or newspaper clippings
-colored threads
-single strand of hair from two individuals with different hair color.
-transparent ruler
We used the following materials to prepare the slides and see the magnified images:
-light microscope with 10X eyepiece, and 4X and 10X objective lenses attached.
– three glass slides
– three coverslips
-water
-plastic pipette
-scissors

Setting up the microscope:
1. I clicked the the low power (4X) objective lens into position.
2. I opened the diaphragm fully.
3. I turned on the microscope light switch.
Preparing the newspaper slides:
1. I cut out a lowercase “o” from the clipping.
2. I placed the o slip facing down on the slide.
3. A drop of water was added to the slide, which turned the paper face up.
4. I gently placed the coverslip atop the o.
5. The process was repeated with lowercase “e” and “r”.
Preparing the hair and string slides:
1. The strands of hair were placed in a crossing position.
2. A drop of water was added to the slide.
3. The coverslip was placed above the cross.
Using the microscope on newspaper slides:
1. The “o” slide was placed on the stage.
2. The microscope was focused using the coarse and fine adjusting knobs.
3. After viewing on 4X, I looked at the o using the 10X lens.
4. I repeated the steps for the “e” and “r” slides.
Using the ruler:
1. The ruler was positioned on the stage so it covered half of the light opening.
2. The ruler was viewed using the 4X and 10X objective lenses.
Using the hair and string:
1. The slide with hair was placed on the stage, with the cross visible through the eyepiece.
2. I observed the slide using the 4X and 10X objective lenses.
3. This was repeated using the string slide.
I noted my observations after viewing all of the slides.

Note: If the mount became dry while viewing, I added a drop of water under the coverslip to improve visualization.

Fig 1:

IMG_0223.PNG
Figure 1 depicts my observations, including qualitative observations with the naked eye and the microscope, as well as estimated widths of the specimens.

Fig 2:

IMG_0178.JPG
Figure 2 depicts the “o” magnified by a factor of forty. As noted in Figure 1, the o appears to be made of dots, and the estimated width is 1200 microns.
Fig 3:

IMG_0185.JPG
In Figure 3, the dots appear larger, as the specimen has been magnified by 100X. The estimated width in this image is 1400 microns.

Fig 4

IMG_0202.JPG
Figure 4 illustrates the “e” at 100X magnification. It appears grainy in texture, and the estimated width is 1200 microns.

Fig 5

IMG_0200.JPG
Figure 5 depicts the “e” at 40X magnification. The estimated width is 1000 microns, and the neighboring character is still visible.

Fig 6

IMG_0190.JPG
Figure 6 shows the “r” at 100X magnification. It appears to be made of dots, and it appears larger than the e and o. The estimated width is 1760 microns.

Fig 7

IMG_0220.JPG
Figure 7 illustrates the cross of the strings at 100X magnification. The strings are estimated to be 600 microns across.

Fig 8

IMG_0217.JPG
Figure 8 depicts the three threads at 40X magnification. Both the twisted structure of the thread and additional loose strands are visible, and the estimated width is 400 microns.
Fig 9

IMG_0212.JPG

Figure 9 depicts two hairs at 40X magnification. The lighter hair is blond, while the darker hair is brown. The brown strand is slightly thicker than the blond hair: the blond hair is about 54 microns across, and the brown hair is about 62 microns across.

Scratches were visible on the surface of the ruler in addition to the 5.5 millimeters in the field of view.

In this lab, we explored the function and uses of a compound light microscope. The microscope has a light below the stage that passes through the specimen and then is refracted by two lenses in a manner that magnifies the specimen.

We observed 6 specimens: hair, string, letters r, e, and o, and the ruler.

*As described in the table, there were several differences and similarities between an image viewed through a microscope and the same image viewed with the naked eye.
With the naked eye, the typeface letters e, r, and o appear to be correctly oriented and facing up. In the microscope, the e and r appeared backwards and upside down. This occurs because the objective and ocular lens are convex. The light rays converge together at a central point: the focal point. When the image is magnified, the objective lens has a short focal length and an upside down image is made (see figure 10 below). This image is then magnified further through the eye piece. The letter e was useful demonstrating this effect, as with the letter o it was harder to see that the image was inverted and upside down.
Figure 10

IMG_0226.PNG

Images appear smaller and inverted when light is focused beyond the lens focal point.

When observed through the microscope, the hair, ruler, and string had minute details that were not apparent with the naked eye. For example, the ruler had fine scratches, and small details like oil and color were apparent when examining the hair. I also noted both the twisted structure of the string and small threads coming out of its main strand.

*When viewing an object through the higher powered objective, not all of the object was in focus. This was most apparent when I observed the overlapping hair and thread. There are 3 reasons for this observation. First, the field of view is largest at low power. This is the best power to locate the specimen. Second, the depth of focus decreases at higher magnifications. Third, at higher power the amount of light is reduced. This diminishes resolving power or the ability to see two close objects as separate items. As we observed the different colored threads, the top thread was in focus, then the middle thread, then the lowest thread. They were not sharply in focus at the same time. The fine-adjustment knob helped focus on different layers of depth, but as one thread came into focus the others went out of focus. This is illustrated below.
Fig 11

IMG_0227.PNG
At higher magnifications the depth of focus decreases
*The order of the overlapping colored threads was black over red over green.

*There is an inverse relationship between the total magnification and the diameter of the field of view. As the magnification increases, the diameter proportionally decreases. This can be further illustrated by the following equation:
diameter of field B = magnification of A X diameter of A
————————————————
magnification of B.
Where a is any magnification at which the diameter of the field is known, and B is any magnification at which the diameter of the field is unknown.

I also observed that moving the slide to the right, made the image move to the left and moving the slide away from me, made the image move towards me.
*The diameter in micrometers of the low power field of view of my microscope was approximately 5.5 mm, or 5500 micrometers.
*To calculate the diameter in micrometers of the high power field, I can use the following equation:
magnification number of higher-power objective
————————————————————— = A
magnification number of lower-power objective

diameter of low-power field of view
—————————-–——————–
A. =diameter of high -powered field of view

The value of A is 10/4, or 2.5. The diameter was found to be 5500 micrometers, when divided by 2.5 equals 2200 microns, the diameter of the high powered field of view.
*The diameter of the high power field was 2200 microns. The hair is about one 31st of the screen, which corresponds to an estimated width of 70 microns.

One problem that I had during the experiment was adjusting the diaphragm to provide even illumination in the photographs. If I were to repeat this experiment, I would like to explore in more depth the inversion of the magnified objects. I would replace the eye piece with another convex lens to see if I could maintain the magnification, but correct the orientation of the observed specimen to match the true specimen. I would also attempt to improve the depth of focus at higher magnification. Next, I would like to determine if varying the light intensity would help with visualization. I would then examine human cells under the microscope, possibly by preparing a wet mount of cells scraped gently from the inside of my cheek. Finally, I would compare a specimen under a light microscope with the images obtained using an electron microscope and a fluorescence microscope.

References:
cas.miamioh.edu/mbiws/microscopes/compoundmicroscope.html

abacus.bates.edu/~ganderso/biology/resources/microscopy.html

Strawberry DNA Extraction Lab Report

The purpose of this experiment is to extract DNA from strawberries. I chose strawberries because they are easy to manipulate and they contain a large genome. I used the alcohol extraction method to isolate DNA and to make it visible to the naked eye.
Strawberries have an octoploid genome, which means that the nucleus contains eight complete copies of each chromosome. Using strawberries in the experiment therefore facilitates the extraction of DNA. Strawberries also contain pectinase and cellulase enzymes, which aid in the degradation of cell walls. (1) The chromosomes are composed of DNA, and they are located inside the nucleus.

DNA is extracted by a four step process: the strawberries are first crushed, which mechanically breaks cell walls, and facilitates degradation by pectinase and cellulase. A detergent solution is then used to dissolve the cell membrane and nuclear membrane, which are composed of a phospholipid bilayer. Salt is added to the solution to precipitate the DNA, and alcohol is then added to extract the DNA. The free DNA strands rise to the top of the solution after alcohol is added. This occurs because ethanol is a nonpolar solvent, and DNA is not soluble in alcohol.

I used the following materials in the experiment:
-1 ziplock plastic bag
-1 strawberry
-1 2″ by 2″ square of cheesecloth
-Funnel
-Test tube
-5 ml detergent
-40 ml distilled water
-Salt
-100ml beaker
-Wooden splint
-Ice cold ethanol
-1 plastic pipette

I first prepared an extraction buffer solution:
1. I mixed 5 ml of detergent with .75 grams of salt in a 100ml beaker.
2. I added 40 ml of distilled water to the detergent solution, and I stirred the solution.

I then broke down the strawberry cells into basic components:
1. I added 10 ml of the extraction buffer solution to a plastic bag.
2. I removed the leaves and sepals from the strawberry and placed it inside the bag.
3. I removed the air from the bag, and I compressed the strawberry.
4. I crushed the bag against the table and formed a strawberry slurry.

I then extracted the strawberry DNA from other large solids in the slurry:
1. I placed a two inch square of cheesecloth over a funnel and secured it with my fingers.
2. I poured the slurry over the cheesecloth, which separated the large solids; and I collected the liquid and DNA in the test tube.
3. I discarded the strawberry solids that remained in the cheesecloth.

Finally, I isolated the DNA from the liquid in the test tube:
1. I filled a quarter of the test tube with strawberry liquid, and I added the same amount of ice cold ethanol.
2. I placed a long wooden splint into the test tube, and I stirred it without shaking the tube. The DNA became visible in the ethanol layer at the top of the test tubes.

Fig. 1


IMG_0148.JPG

Figure 1 illustrates the whole strawberry and extraction buffer in a sealed plastic bag. The detergent degrades the phospholipid bilayer of the cell and nuclear membranes after the strawberry is crushed.

Fig. 2
IMG_0149.JPG

Figure 2 depicts the crushed strawberry prior to removal of the large solids. At this step of the experiment, the detergent dissolves cell and nuclear membranes, and DNA remains in the extraction buffer solution.

Fig.3
IMG_0150.JPG

Figure 3 illustrates the separation of strawberry liquid from large solids with a cheesecloth filter. The strawberry liquid, which contains DNA, is in the container on the bottom.

Fig. 4
IMG_0154.JPG

<img src=

<a href="

Figure 4 depicts the test tubes after DNA is extracted from the liquid with ethanol. The ethanol is the top layer, and it contains visible strands of DNA. The DNA is visible because it is not soluble in a nonpolar solvent such as ethanol.

Fig. 5
IMG_0157-1.PNG

Figure 5 lists my observations of the appearance of the strawberry, DNA, and test tube in tabular form during each step of the experiment.

In this experiment, I successfully extracted DNA from a strawberry, and I was able to observe visible strands of DNA. The extraction of DNA was facilitated by the presence of eight copies of each chromosome, or an octoploid genome, in the strawberry. In contrast, humans have a diploid genome, which includes only two copies of each chromosome. I degraded the strawberry cell walls, cell membranes, and nuclear membranes by crushing the berry and mixing it with a buffer of saltwater and dish detergent. The mashing physically disrupted the cell walls, the detergent dissolved the membrane phospholipid bilayers, and the salt provided optimum osmolarity. The naturally occurring pectinase and cellulase enzymes also promoted cell wall degradation. The large solids were then separated by filtration, and the resulting solution was collected in a test tube. At that time, the DNA was dissolved in water, which is a polar solvent; and sodium ions bonded with the negatively charged DNA via an ionic bond. After the addition of ethanol, DNA precipitated into the nonpolar layer, which made the long DNA strands easily visible to the naked eye.

If I were to repeat this experiment, I would attempt to extract DNA from other fruits; including other berries, apples, and bananas. I anticipate that it would be more difficult to extract DNA from cells that have fewer copies of chromosomes. I would also experiment with different dish soaps in order to determine if products advertised as “tough on grease” would more readily dissolve the phospholipid bilayer of cell and nuclear membranes. Finally, I would vary the amount and timing of salt added to the extraction buffer. I anticipate that the quantity of DNA seen in the alcohol layer would vary if salt were omitted, as the DNA would be less polar at the time of extraction. I would also be interested to learn if adding more salt would result in the extraction of a larger quantity of DNA.

1. http://www.isof.org/SOP/Shared%20Documents/DNA_extraction.doc