In this lab, I looked at the habitats and ecosystems found on the Bellarmine Campus. During this lab, I classified and analyzed various organisms found on campus into their respective niche in the Bellarmine Ecosystem. On campus, I was capable of finding an entire food web, with numerous producers, primary, secondary, and tertiary consumers, as well as various decomposers. In addition, I found that Bellarmine is home to threatened and endangered species, several non-native species, and pollutants. Bellarmine has a very diverse biotic community.
Ecology, which derives from Greek oikos, meaning “study of our home” is the study of the interactions of the populations, communities, and ecosystems of organisms to their environments on Planet Earth. An organism’s environment consists of two factors, biotic and abiotic factors. Biotic factors are the living portions of an environment, such as other organisms, while abiotic factors are the nonliving, chemical aspects of an organism’s environment, including sunlight, temperature, weather, humidity, soil type, amount of water, and rocks.
The history of ecology began in 1866 when Ernest Hackel, a German biologist, coined the word “oekologie” to define the interactions between animals and their environment. Then, in 1914, Victor Shelford, an animal ecologist, began to emphaise the importance of the relationships between plants and animals. Following Shelford’s breakthrough, ecologist A. G. Tansley theorized that plants and animals were parts of a system including physical factors as well, coining the term ecosystem. An ecosystem is defined by E.O. Wilson’s Life on Earth as “the natural unit consisting of all the habitats and communities in a given place, and the interactions that take place between them.” All ecosystems collectively form the biosphere. Later, Victor Shelford and F. E. Clements would introduce the concept of biomes, defined as “major regional biotic communities of plants and animals together.” Examples of biomes include the tundra of Northern Canada, and the Tropical Rainforests of the Amazon River Basin.
There are two forms of ecology, autecology and synecology. Autecology is the view of individual organisms and how they influence or are influenced by their environment, while synecology considers all interactions within an given ecosystem. For this lab, I primarily focused on autecology, but also implemented forms of synecology. The interpretations of synecology and autecology are shown in Figure 1.
Figure 1: 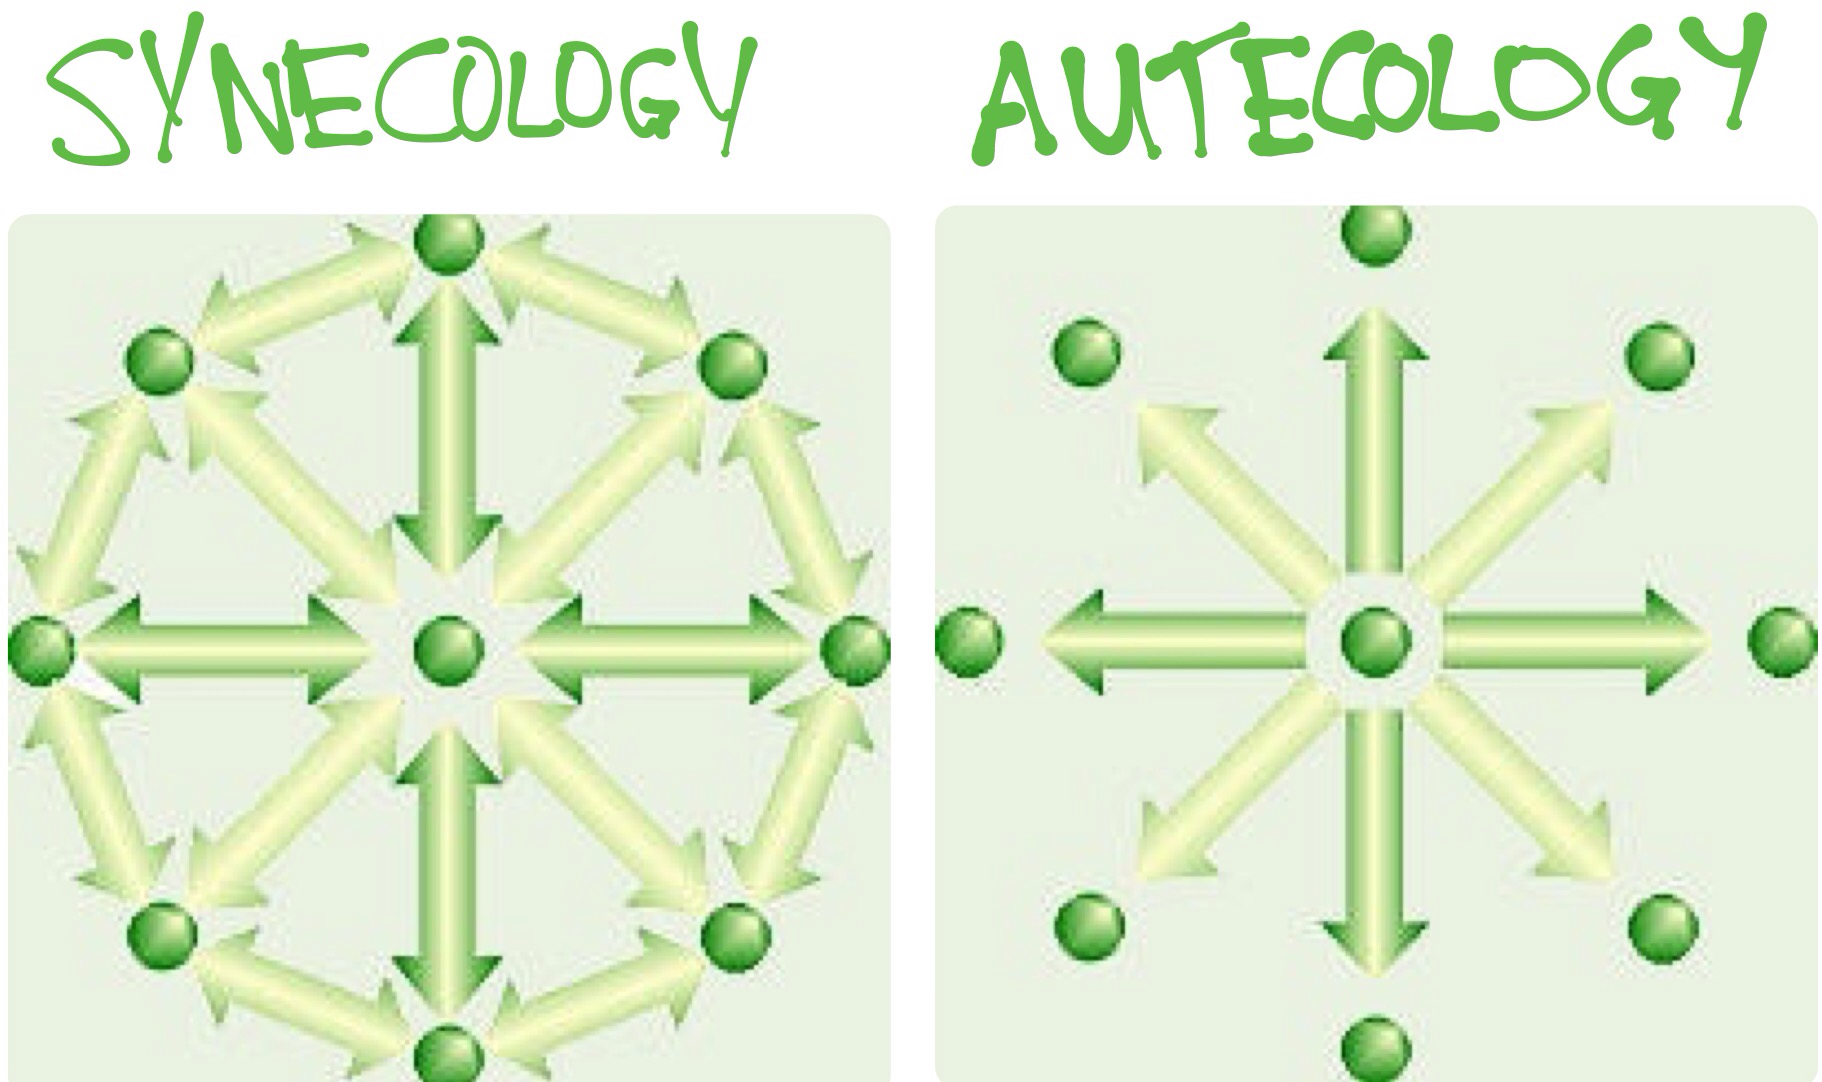
Ecology is characterized by the numerous landscapes and environments on Earth. There are two kinds of biomes that encompass all of the ecosystems on planet Earth, terrestrial and aquatic biomes.
Terrestrial biomes include forests, grasslands, tundra, and deserts.
There are three unique kinds of forests, tropical rainforests, temperate forests, and taiga, all of which amount to over a third of the Earth’s terrestrial land.
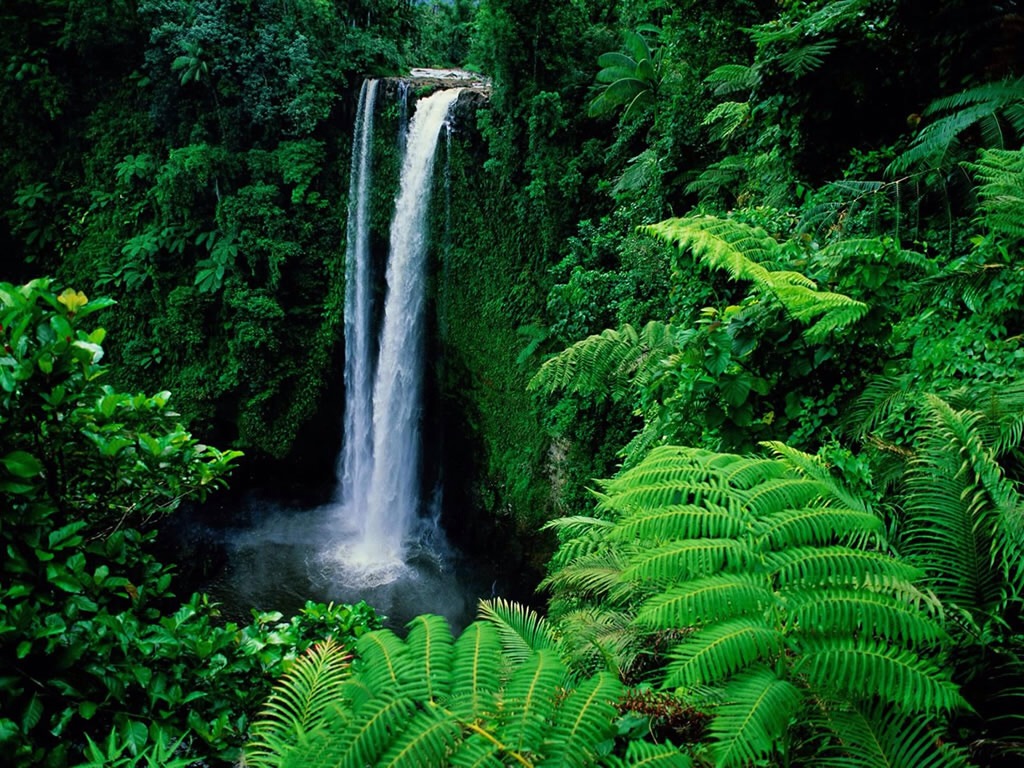
Tropical forests are found in the regions between the Tropics of Capricorn and Cancer, located between 23 N and 23 S. Characterized by its warm, humid climate and large quantities of rain, tropical forests are the most diverse biome. Tropical forests also exhibit poor soil conditions, allowing epiphytes to adapt to retain the small amounts of nutrients they can recieve. A tropical rainforest in the Amazon River Basin is depicted in Figure 2.
Figure 2:
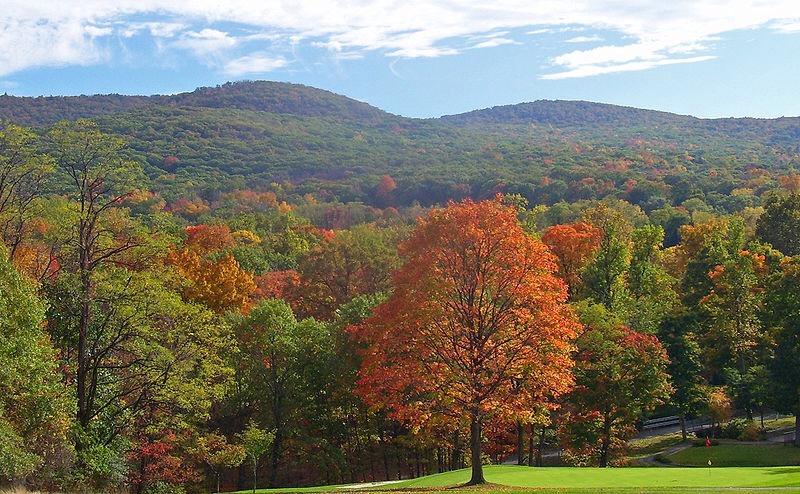
 Temperate forests, consisting of both deciduous and coniferous trees, grow in moderate climates. In areas with less rainfall, conifers dominate, while in wet areas, dedicuous trees thrive. The soils is of good quality, due to the decomposition of the leaves lost by dedicuous trees. A majority of the Eastern United States is temperate forests, as is the temperate forest in Figure 3.
Figure 3:
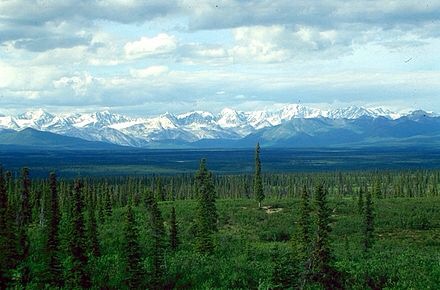
Boreal forests, also categorized as taiga, is the largest biome on land. Comprised of evergreenns, they are found between 50° and 60° north, and form across North America , Europe, and Siberia as in Figure 4. Taiga (“marshy forest”) have short wet summers, and winters are cold.
Figure 4:
Similar to forests, there are three kinds of grasslands: savannas, steppes, and praries. As the name suggests, grasslands are predominantly covered by grass, with scattered trees. In general, savannas and praries have longer grass than steppes.
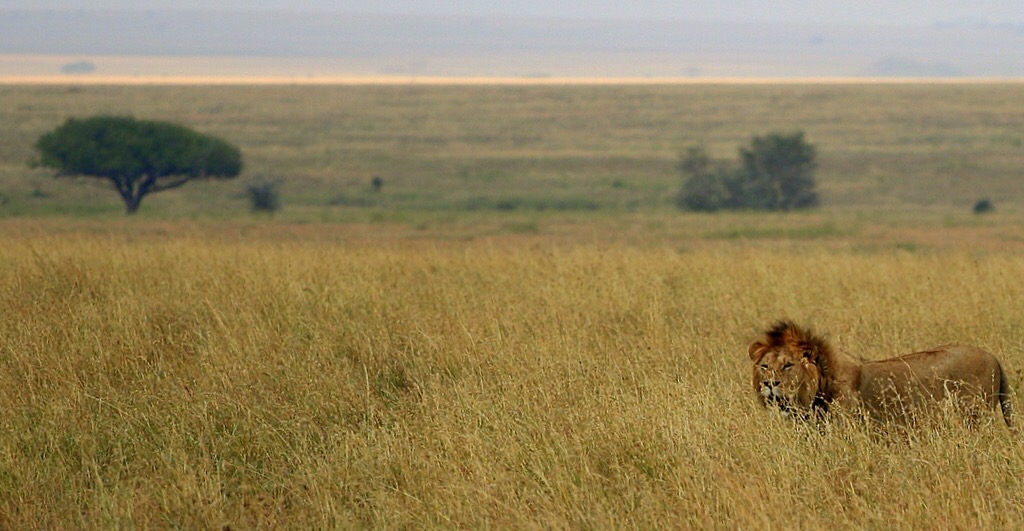
Savannas, found throughout the continent of Africa, teem with herds of wild animals. With a distinctive short wet season and a long dry season, fires rampage the plains of Africa, allowing for grasses to dominate local trees. Savannas account for around 20 percent of the Earth’s landmass. An African savanna in the Serengheti National Park is depicted in Figure 5.
Figure 5:
 Prairies are found across North America and have been symbolized in numerous works of literature. Characterized by its tall grass and herds of roaming bison, the North American prairies account for almost all of the central United States. The praries where created partially by the rain shadow of the Rocky Mountains. As seen in Figure 6, a prairie in rural Wyoming is characterized by its long grass.
Figure 6: 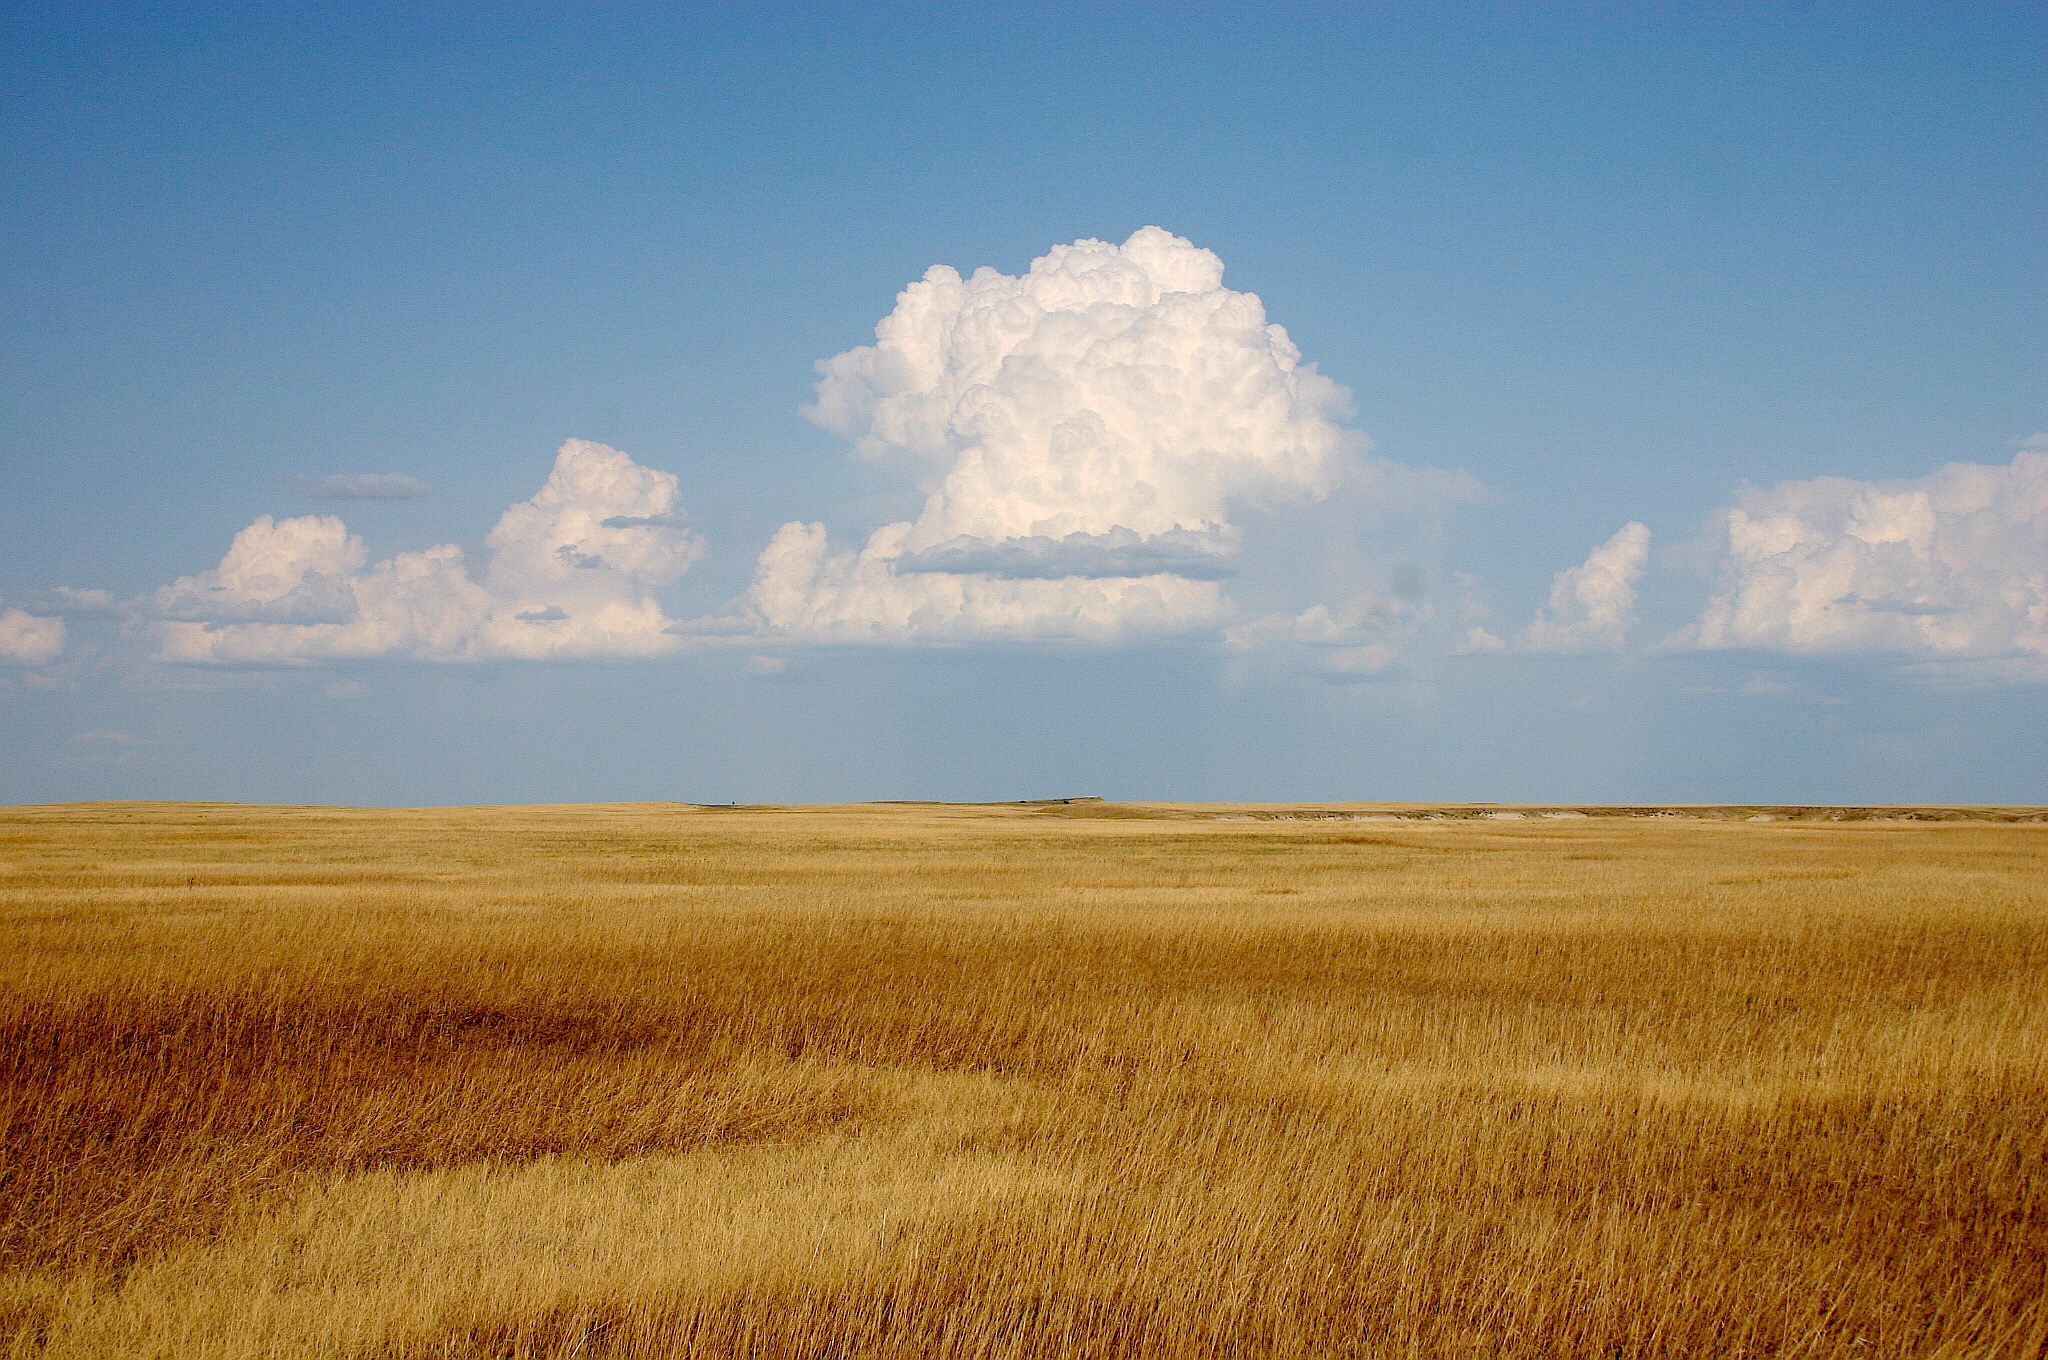
Steppes are short grass grasslands found furthest away from the equator. Steppes can be found in Patagonia to Mongolia, where they were used by the Mongols to create their vast Empire and Postal system. Steppes possess a semi-arid climate as well. As seen in figure 7, a Tibetian fox, navigates the Tibetian Steppes, walking between the short grass.
Figure 7: 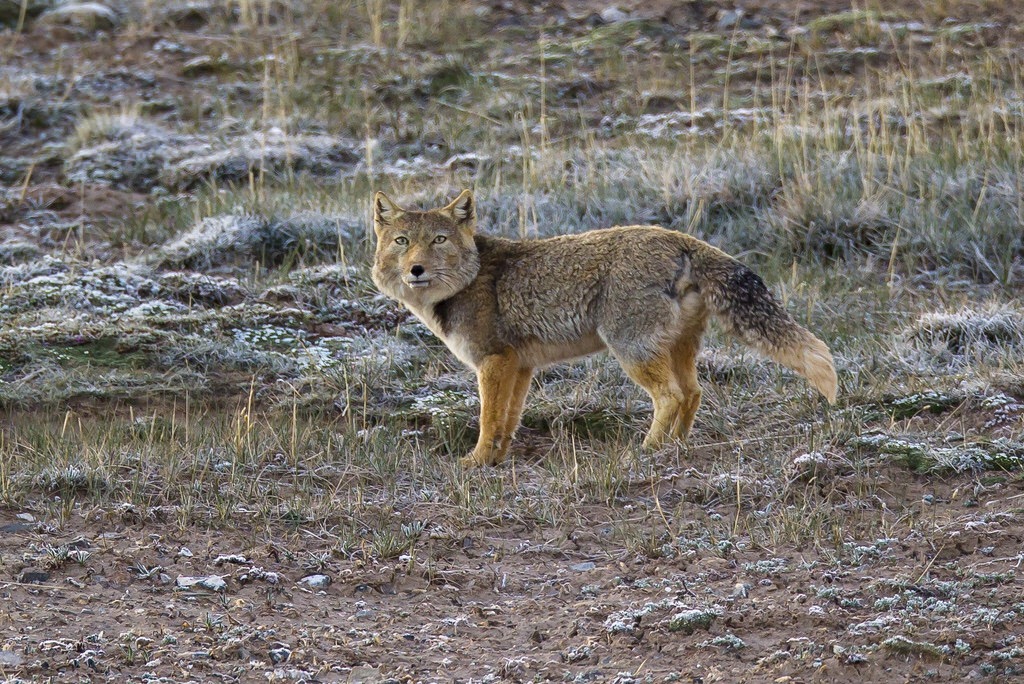
Tundra, found across the northern parts of Canada, Scandavia, and Asia. “Tundra” derives from Finnish, meaning “treeless plain.” Hardy plants and animals endure the lack of water, poor soil, and cold climate found across the Arctic tundra. Large plant and animal life is prohibited by the hard permafrost frozen even throughout the Artic summer. As seen in Figure 8, the tundra is dominated by lowline shrubs and glacial ice.
Figure 8: 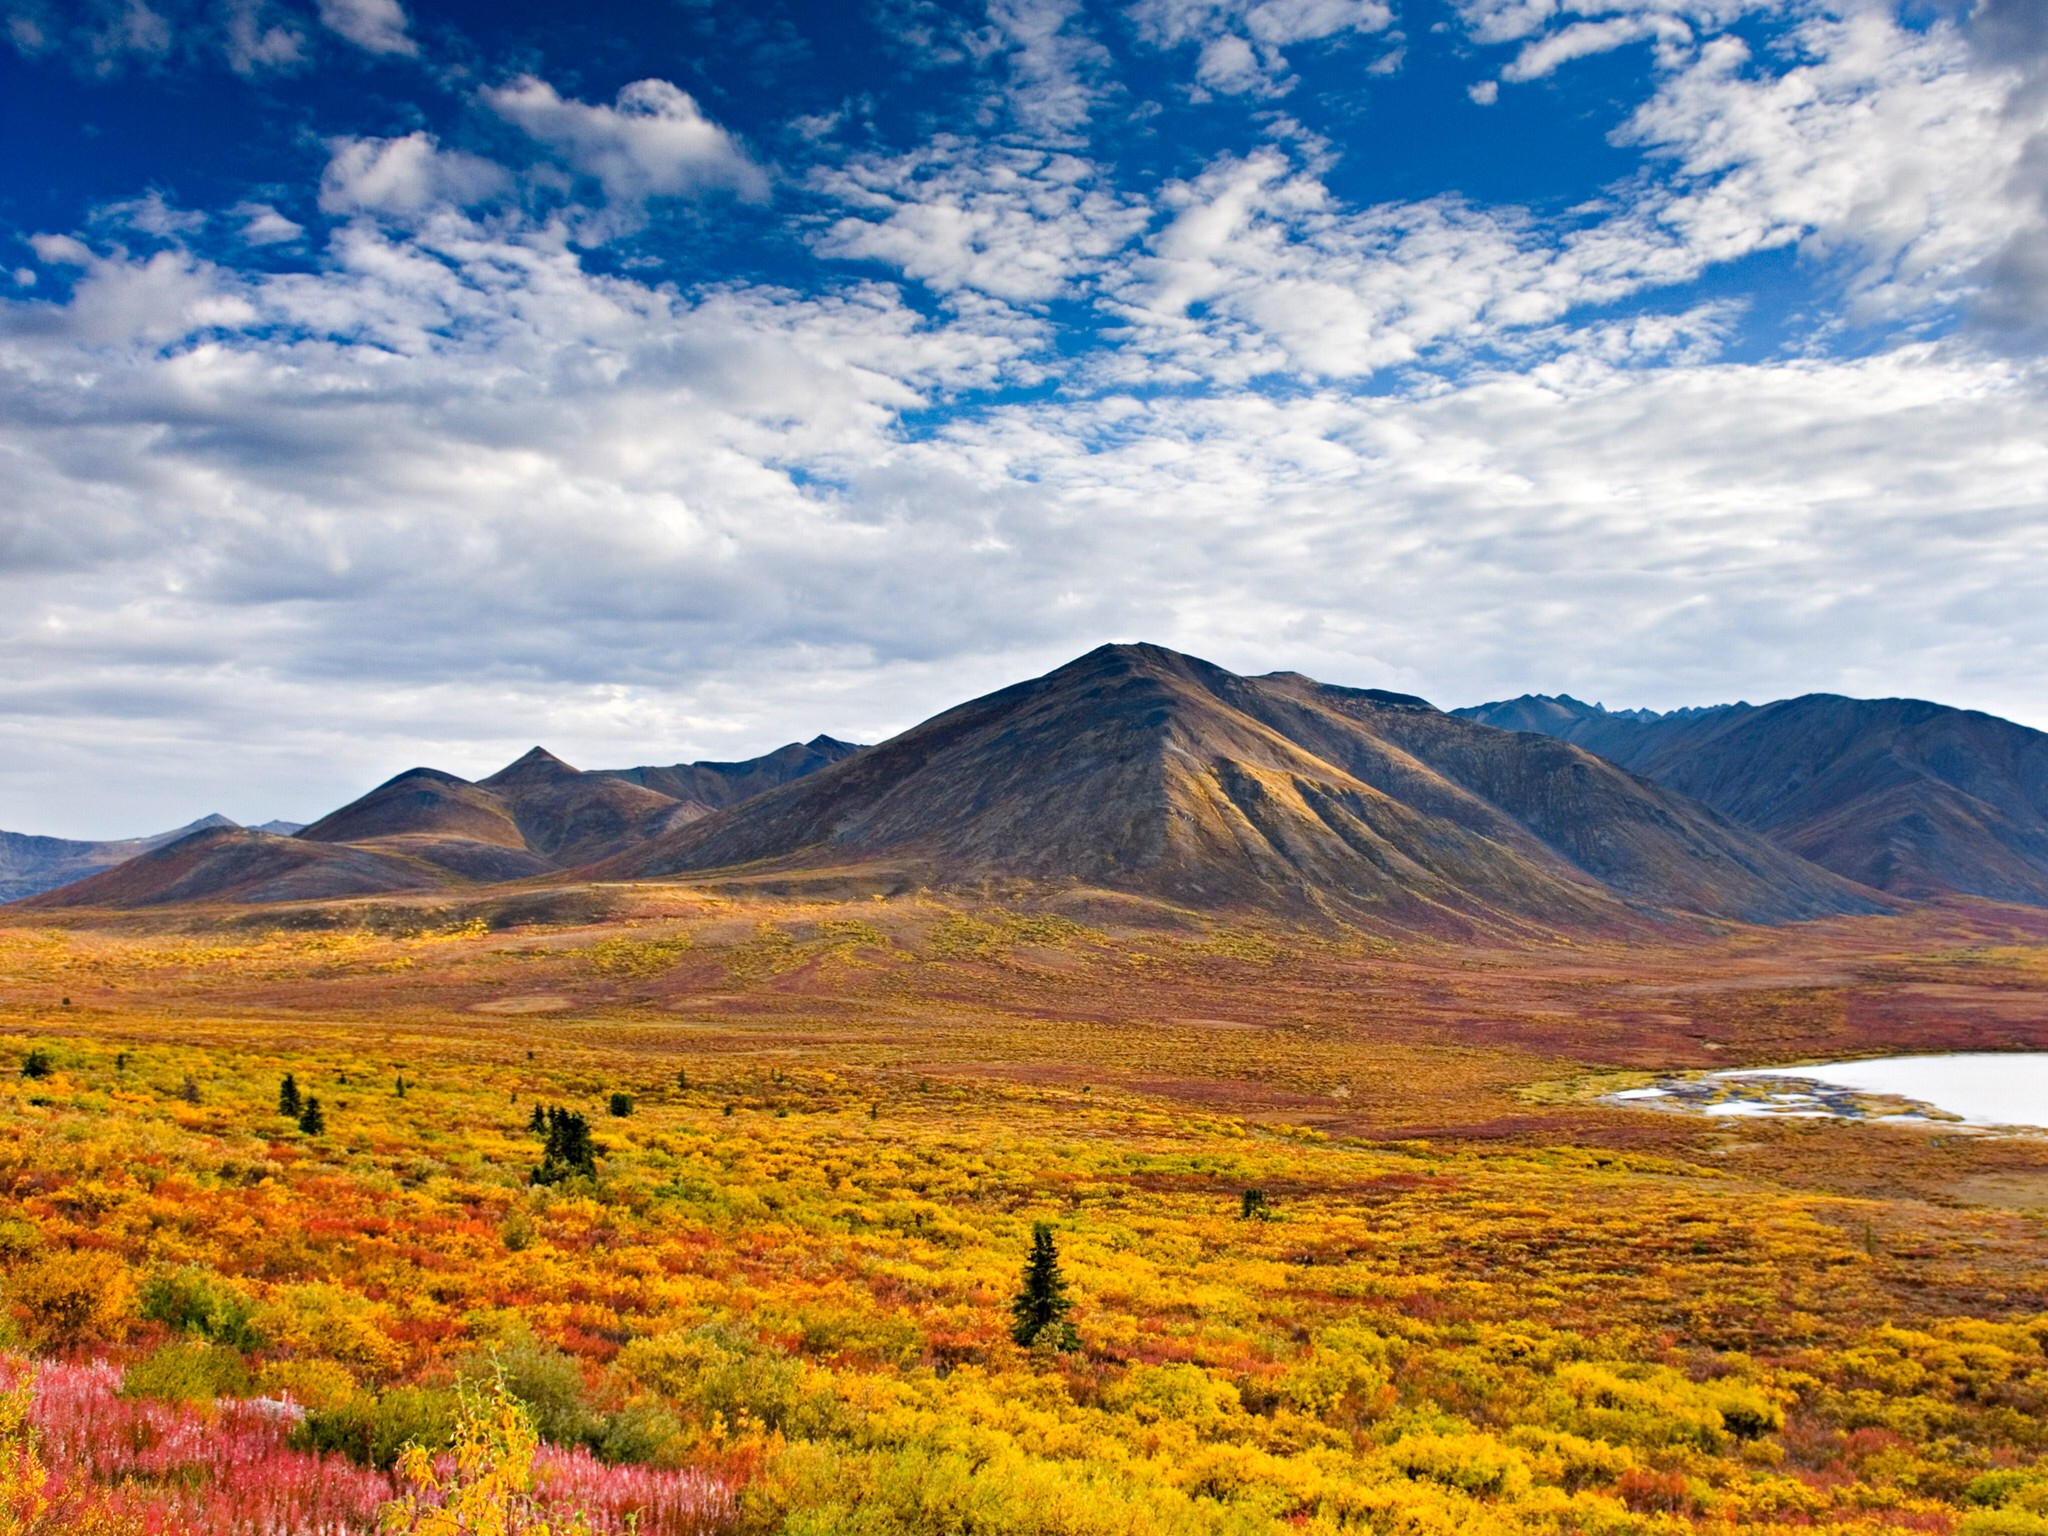
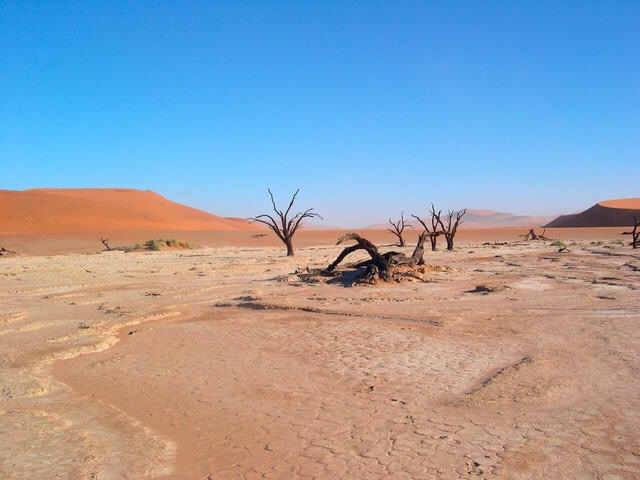
Deserts, the most dry and barren biome, are found across the world. Desert dwellers must adapt to survive with the lack of water, food, and hot temperatures. Many desert communities are nocturnal, to take advantage of cooler temperatures. As seen in Figure 9, the desert has much less vegetation compared to other biomes, and has a hot climate.
Figure 9:
Ecologists recognize four branche of ecology, behavioral ecology, physiological ecology, chemical ecology, and mathematical ecology.
Behavioral ecology, pioneered by ethnologist Konrad Lorenz, focuses on the interactions between animals. Lorenz famously discovered imprinting is ducklings, in which ducklings perceive the first thing they see and hear to be their mother.
Physiological ecology studies the affects of abiotic factors on organisms. Ecologist Justus Lingberg first discovered that plants need adaquete nutrients in the soil to survive.
Chemical ecology studies the chemical communication, defense mechanisms, and smells of organisms. One example of chemical ecology is the defense mechanism of a skunk, spraying maladorous sulfur compounds at attackers.
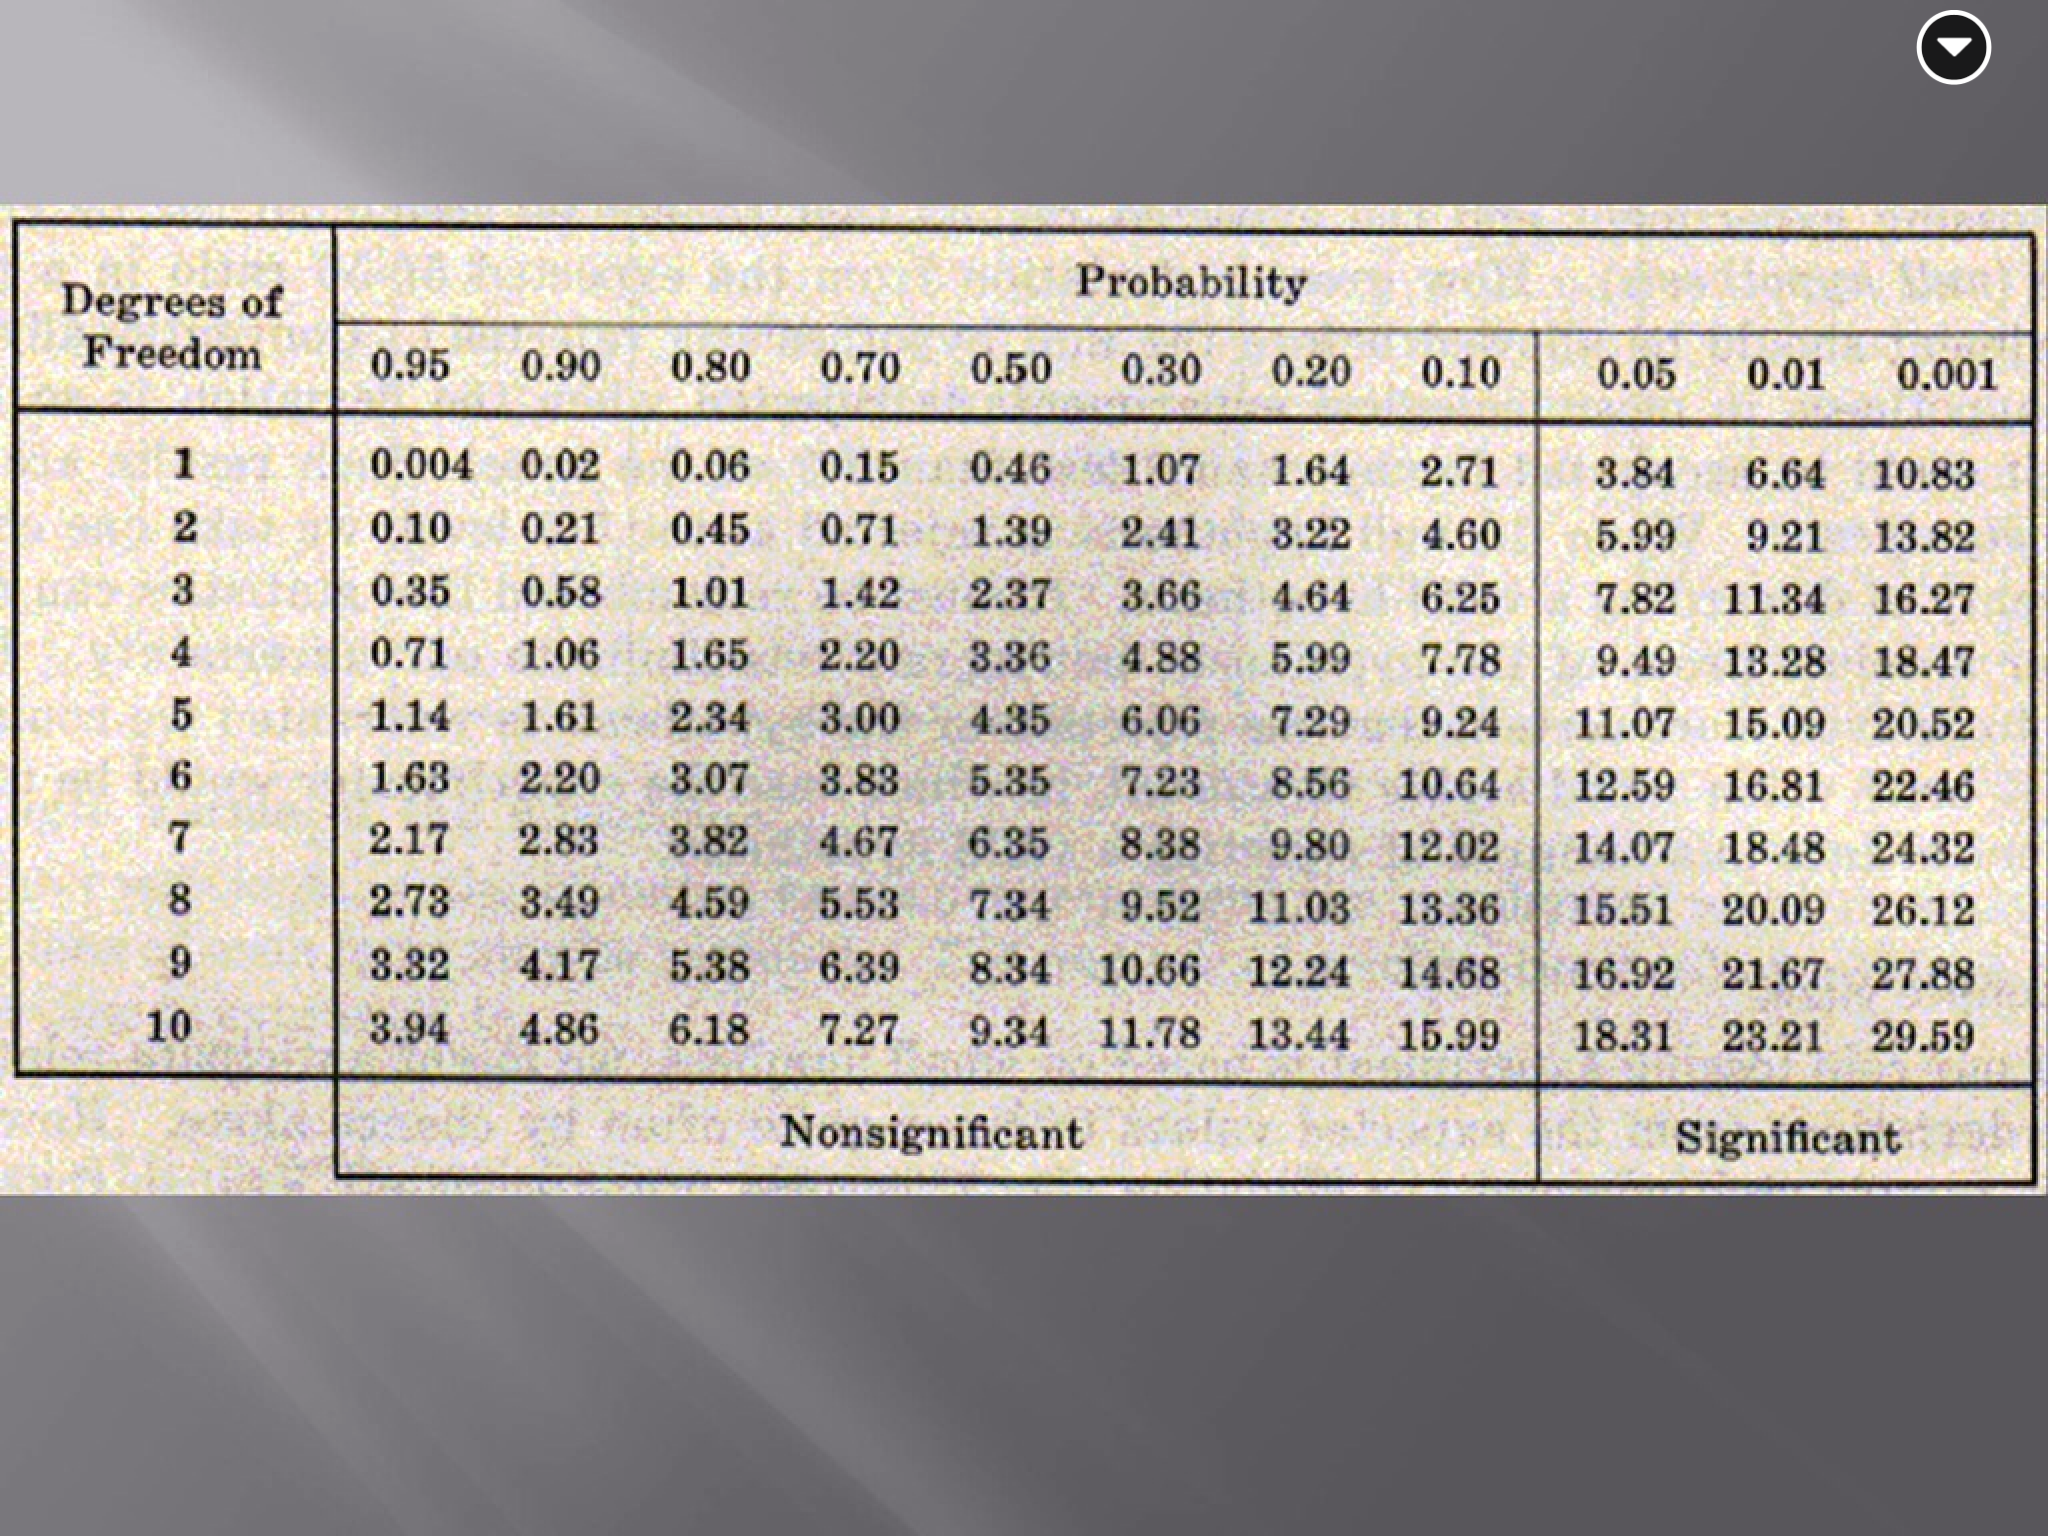
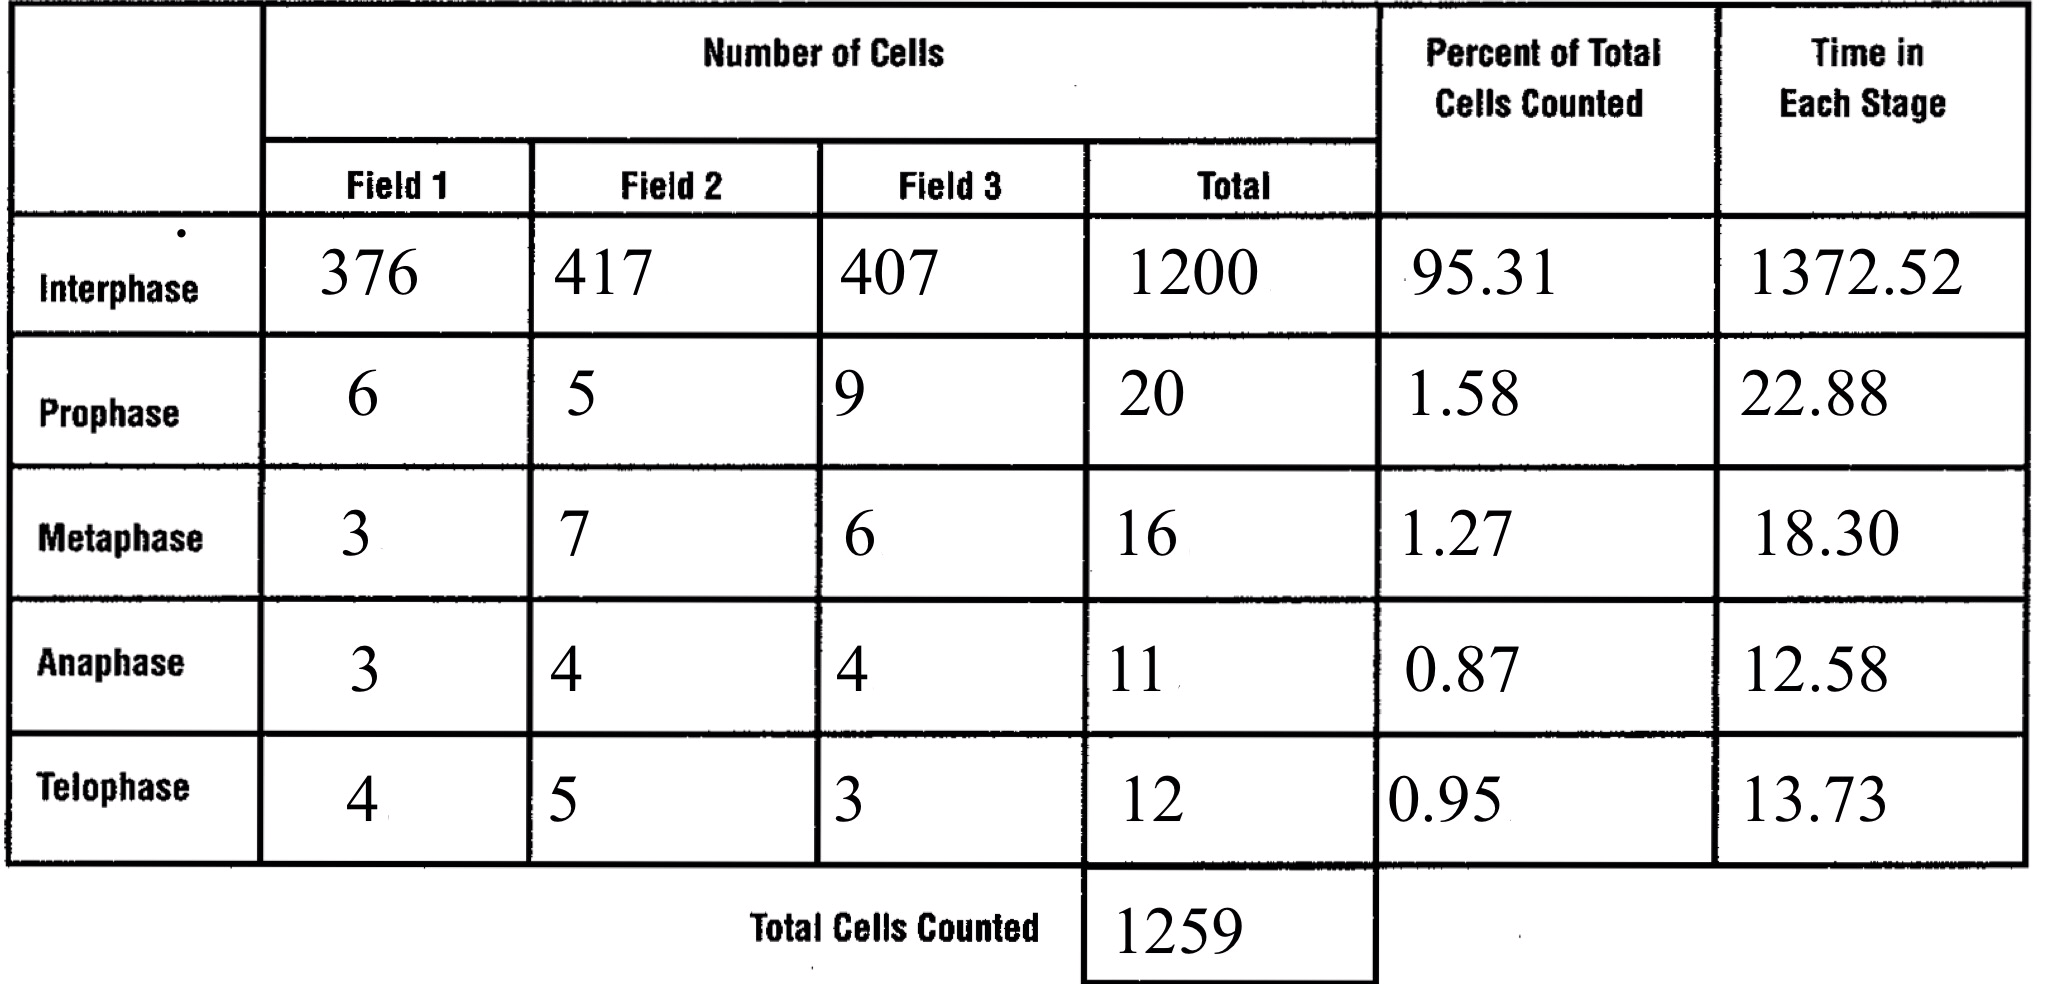
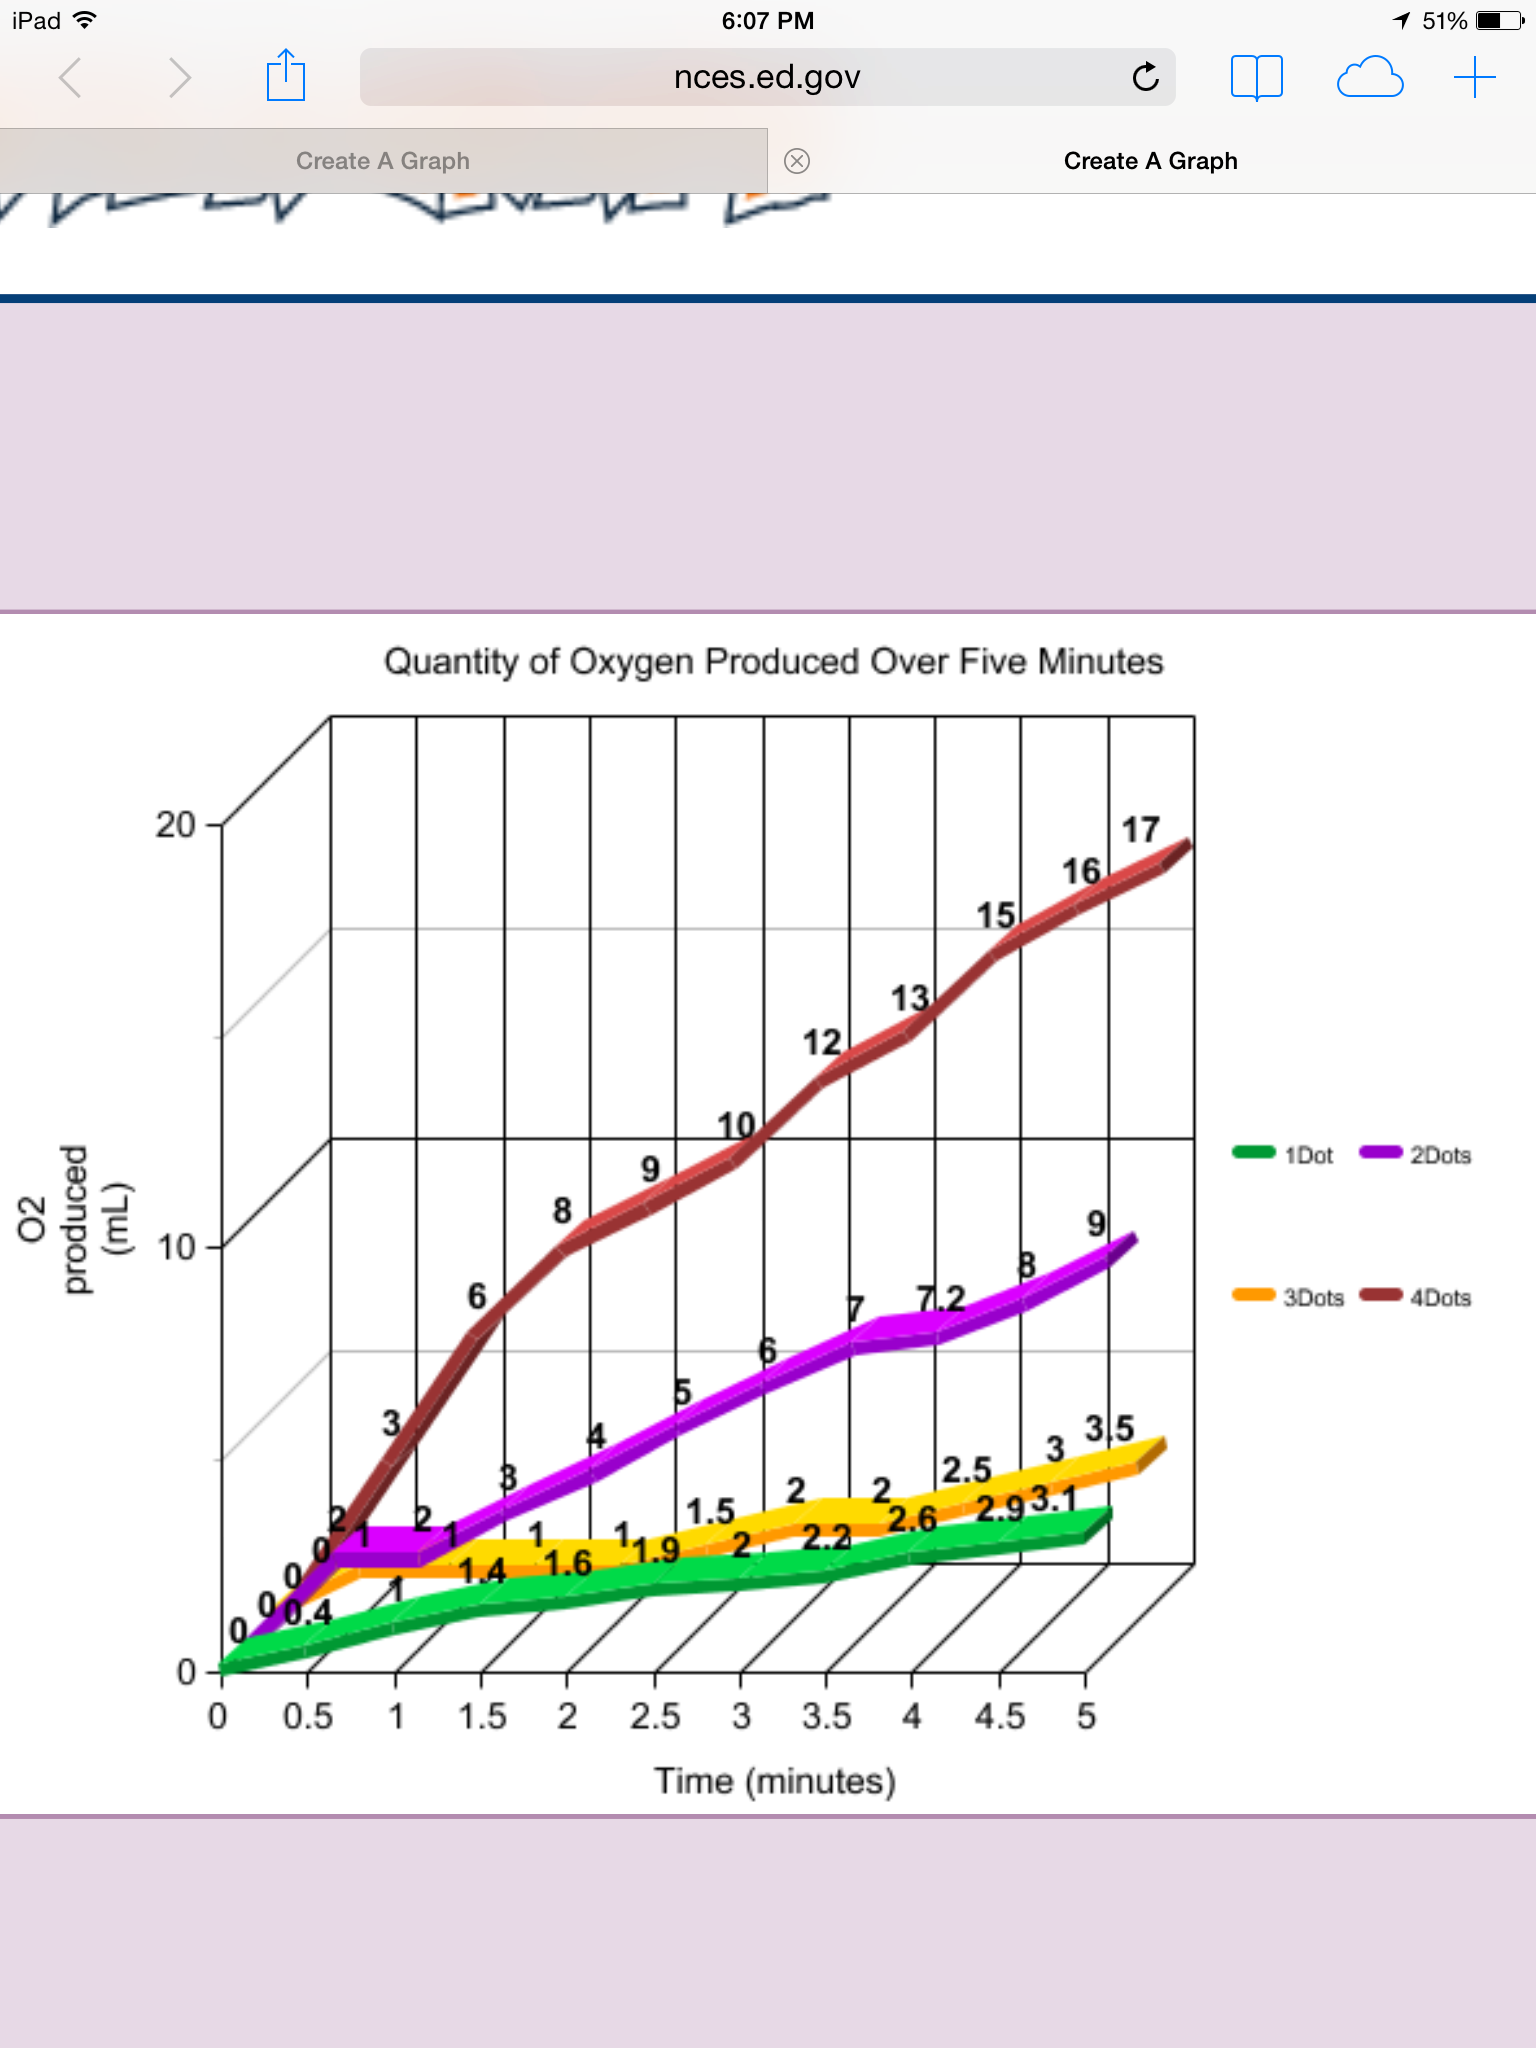
Mathematical ecology involves the quantitative data of ecology, including population growth and average mass, gestation period, and life expectancy of organisms. From this data, scientists can establish potential predators in the area, parasites that may harm the organisms, or diseases that have an adverse affect on an organism. For example, as seen in Figure 10, matcha toca, ecologists can determine that the population of hares directly correlates to the population of lynx, as the fewer number of hares, the greater number of Lynx.
Figure 10:
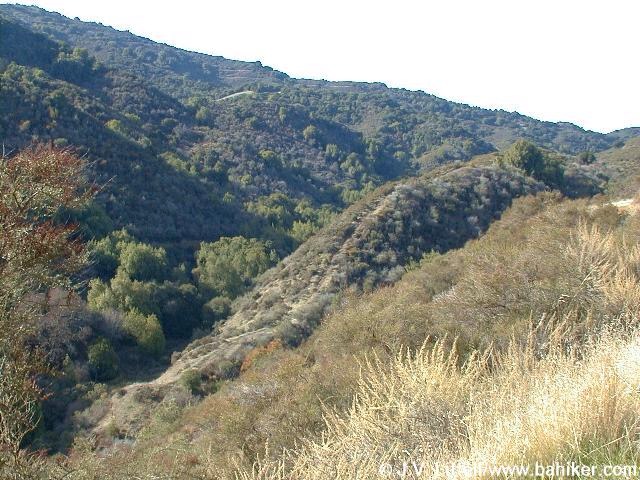
At Bellarmine, we live in a region comparable to a Chaparral. A Chaparral is a dry temperate forest, similar to the biome of the Mediterranean. The chaparral possess numerous scrubs (as seen in Figure 11) and has plants with large leaves and animals associated with deserts and forests, such as coyotes, deer and jack rabbits.
Figure 11:
Materials:
- Camera
- Various Ecology Apps: (LeafSnap, Project Noah, Merlin Bird ID, iNaturalist)
Procedure:
- I located an organism or pollution source.
- I identified the species and name of the organism using the various apps. If a plant, I used LeafSnap, if a bird, I used Merlin ID, and for other organisms, I used a combination of iNaturalist and Project Noah.
- I identified plants, animals, and pollution sources to fit the following categories depicted in Figure 12.
Figure 12:
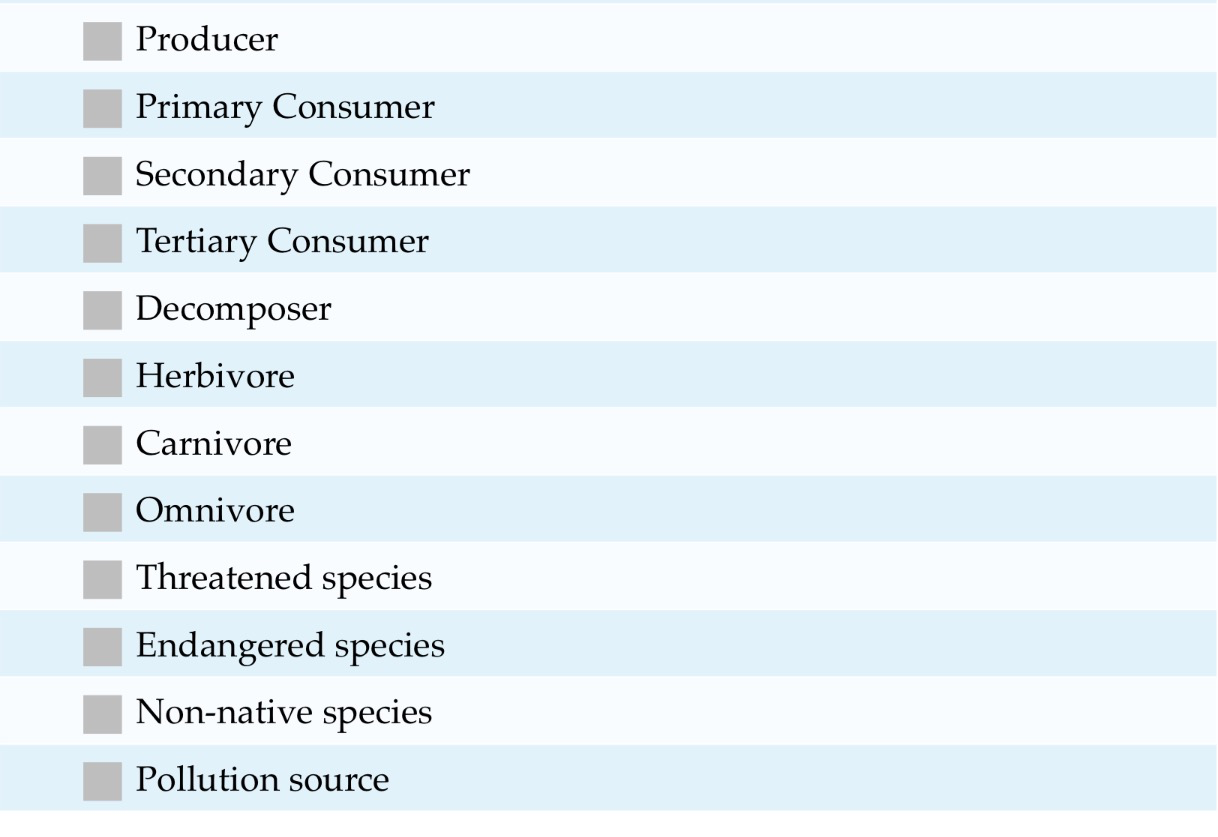
Figure 13:
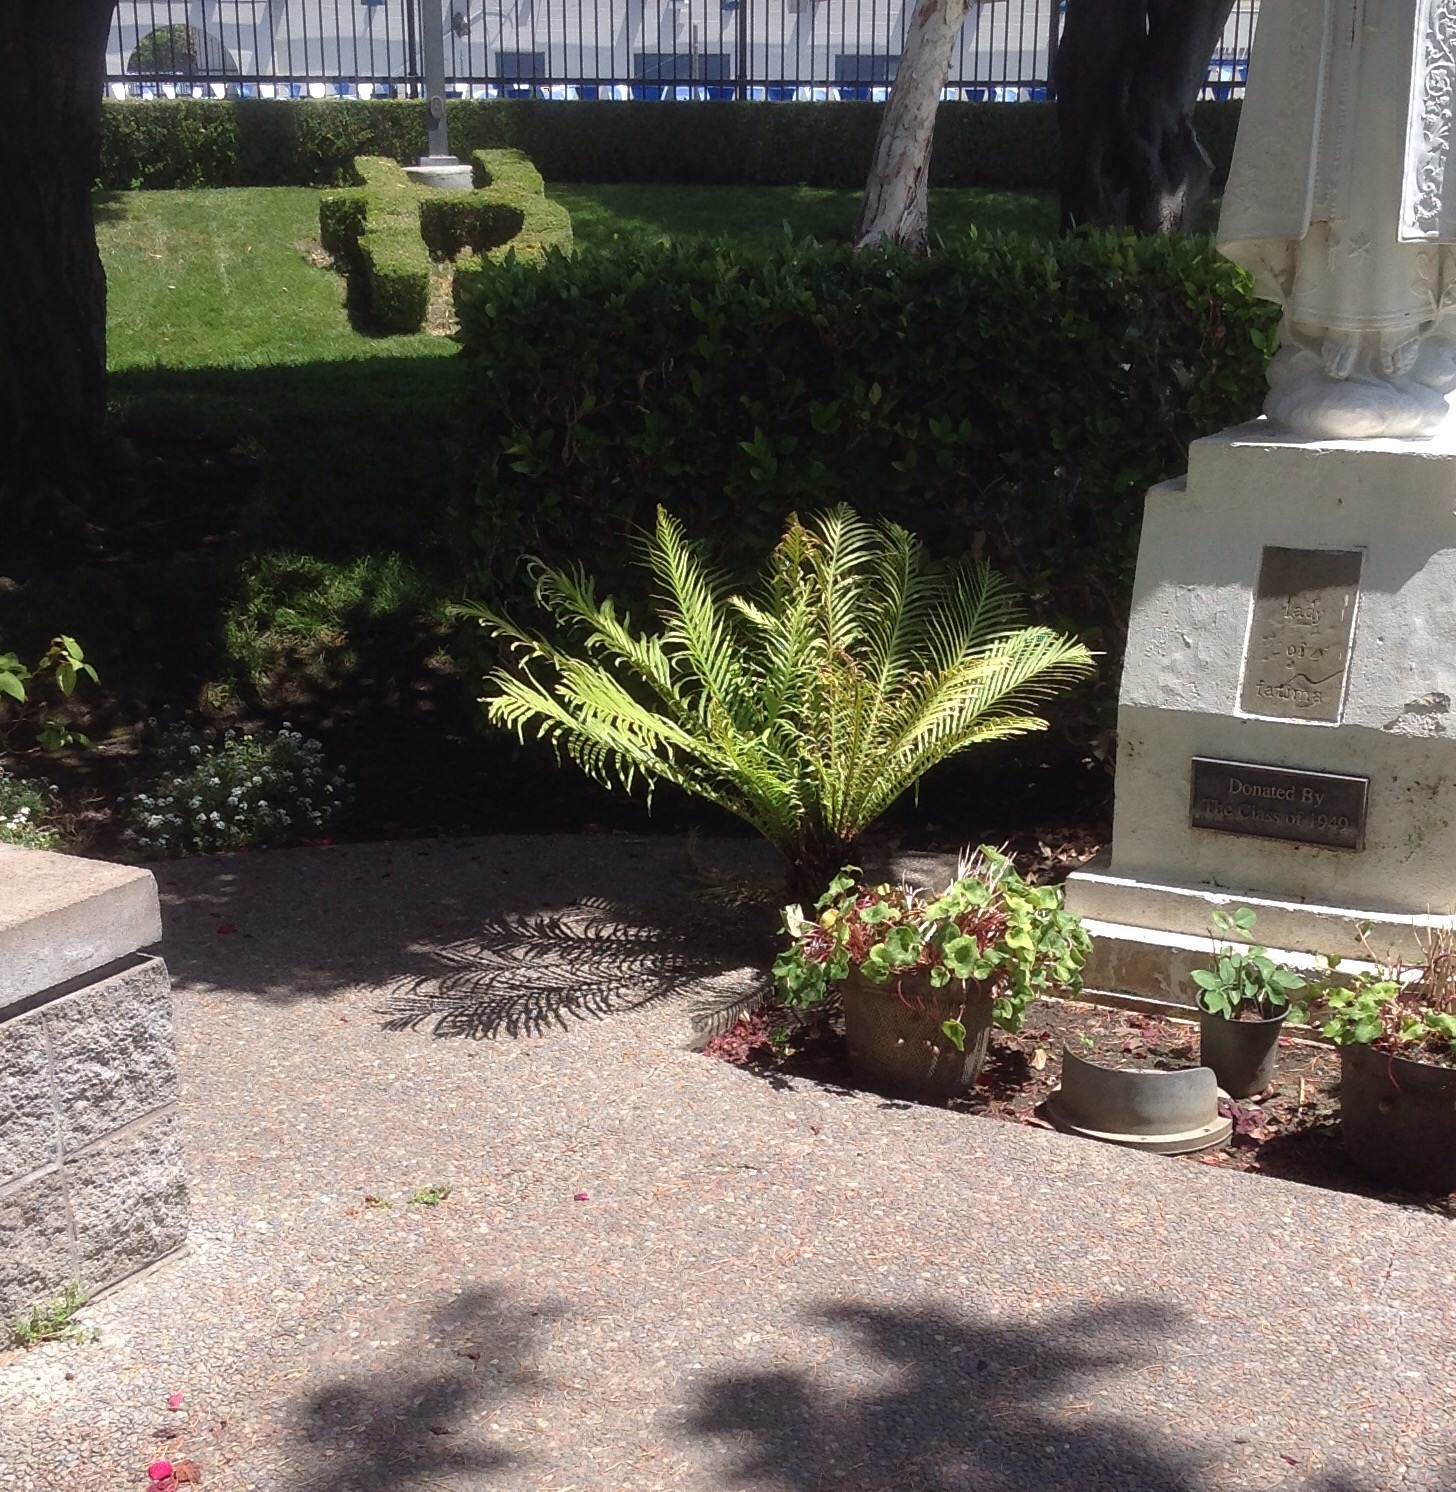
Common Name–Areca Palm Tree
Scientific Name–Chrysalidpcarpus Lutescens
As seen in Figure 13, a juvenile Areca Palm Tree (Chrysalidpcarpus Lutescens) is a primary producer found in the Bellarmine Quad. Palm Trees, the only members of the family Arecacaea and order Arecales, generally grow in hot climates. There are over 3000 species of Palm trees, some of which are indigenous to the United States. Having a distinct appearance in the fossil record, palm-like monocots date back to 70 Million years ago. Ther are two major groups of Palm trees, pinnate feather leaved, like Acera Palms, and palmate and fan shaped leaved palms. Palm trees can grow in tropical to semitropical climates, and is located near the Statue of Mary in the Bellarmine Campus.
Figure 14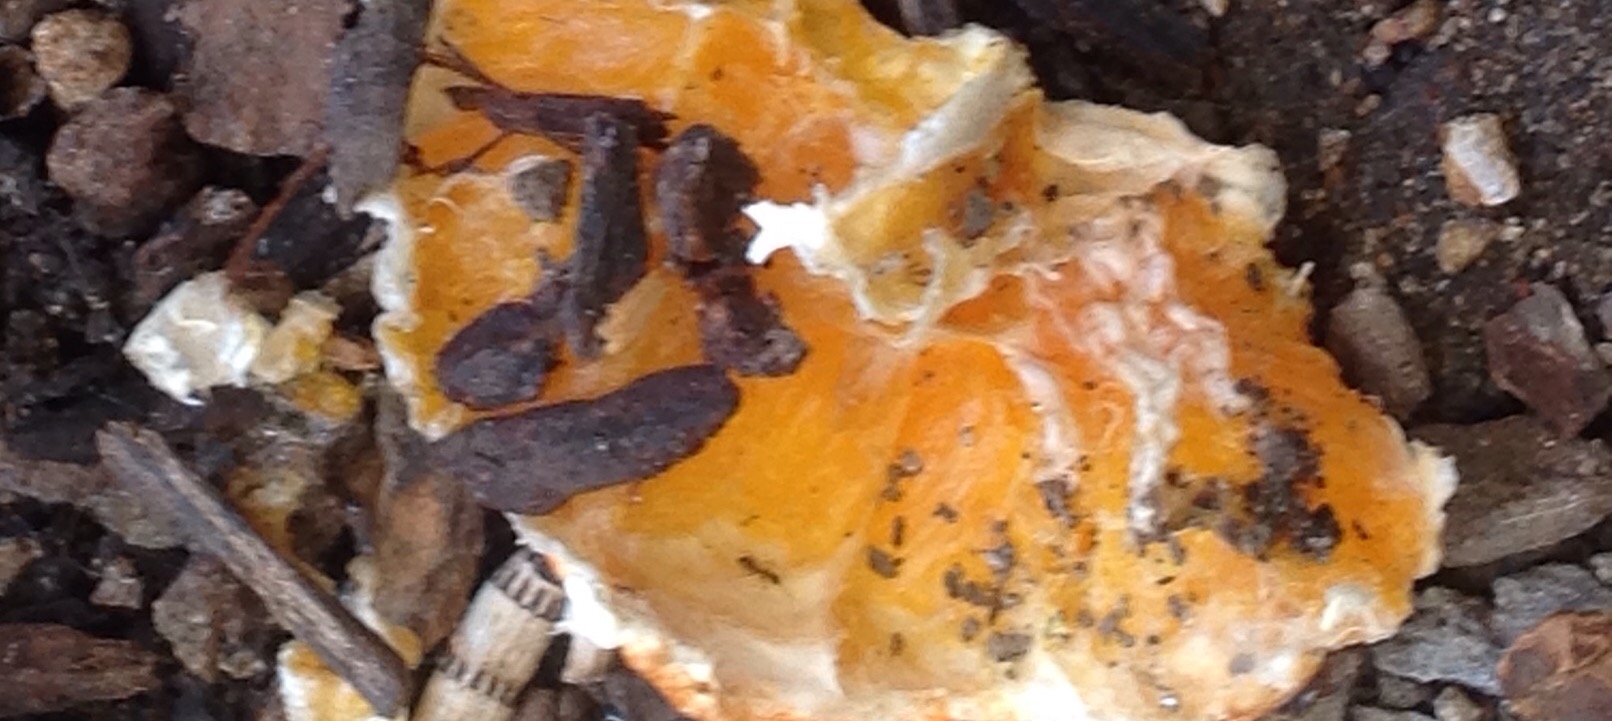
Common Name–Black Garden Ant
Scientific Name–Lasius Niger
As seen in Figure 14, a Black Garden Ant (Lasius Niger) is a primary consumer found on the Bellarmine campus. Like most ant colonies, the Black Garden Ant has a colony centered around a sole queen ant. Having a fossil record dating back 92 Millennia. This particular Black Garden Ant was found on a discarded Orange outside of Sobrato, however Black Garden Ants can be found throughout the Northern Hemisphere.
Figures 15-16:
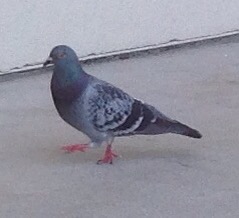
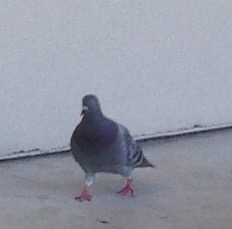
Common Name–Rock Dove
Scientific Name–Columba Livia
As seen in Figures 15-16, rock doves around Carney are secondary consumers, eating Incests. rock Soves can be found worldwide, but are indigineous to Europe and the Middle Easet. Rock Doves, or pigeons as they are often mislabeled, are gregarious, and occanassionally interact with other doves. At Bellarmine, rock doves are found across campus, yet these birds were found outside Carney.
Figure 17
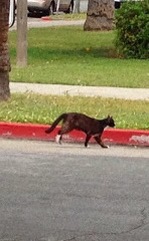
Common Name–Tabby Cat
Scientific Name–Felis catus
As seen in Figure 17, Cindy’s Tabby Cat (Felis catus) is a tertiary consumer. A variety of domestic cats with splotches and distinctive stripes, Tabby Cats originated from African Wild Cats with similar markings. The tabby pattern, in fact is not specific to a certain breed, and is in fact a wild type among cats. This tabby cat was found behind Bellarmine near Cindy’s but cats have been domesticated worldwide.
Figure 18:
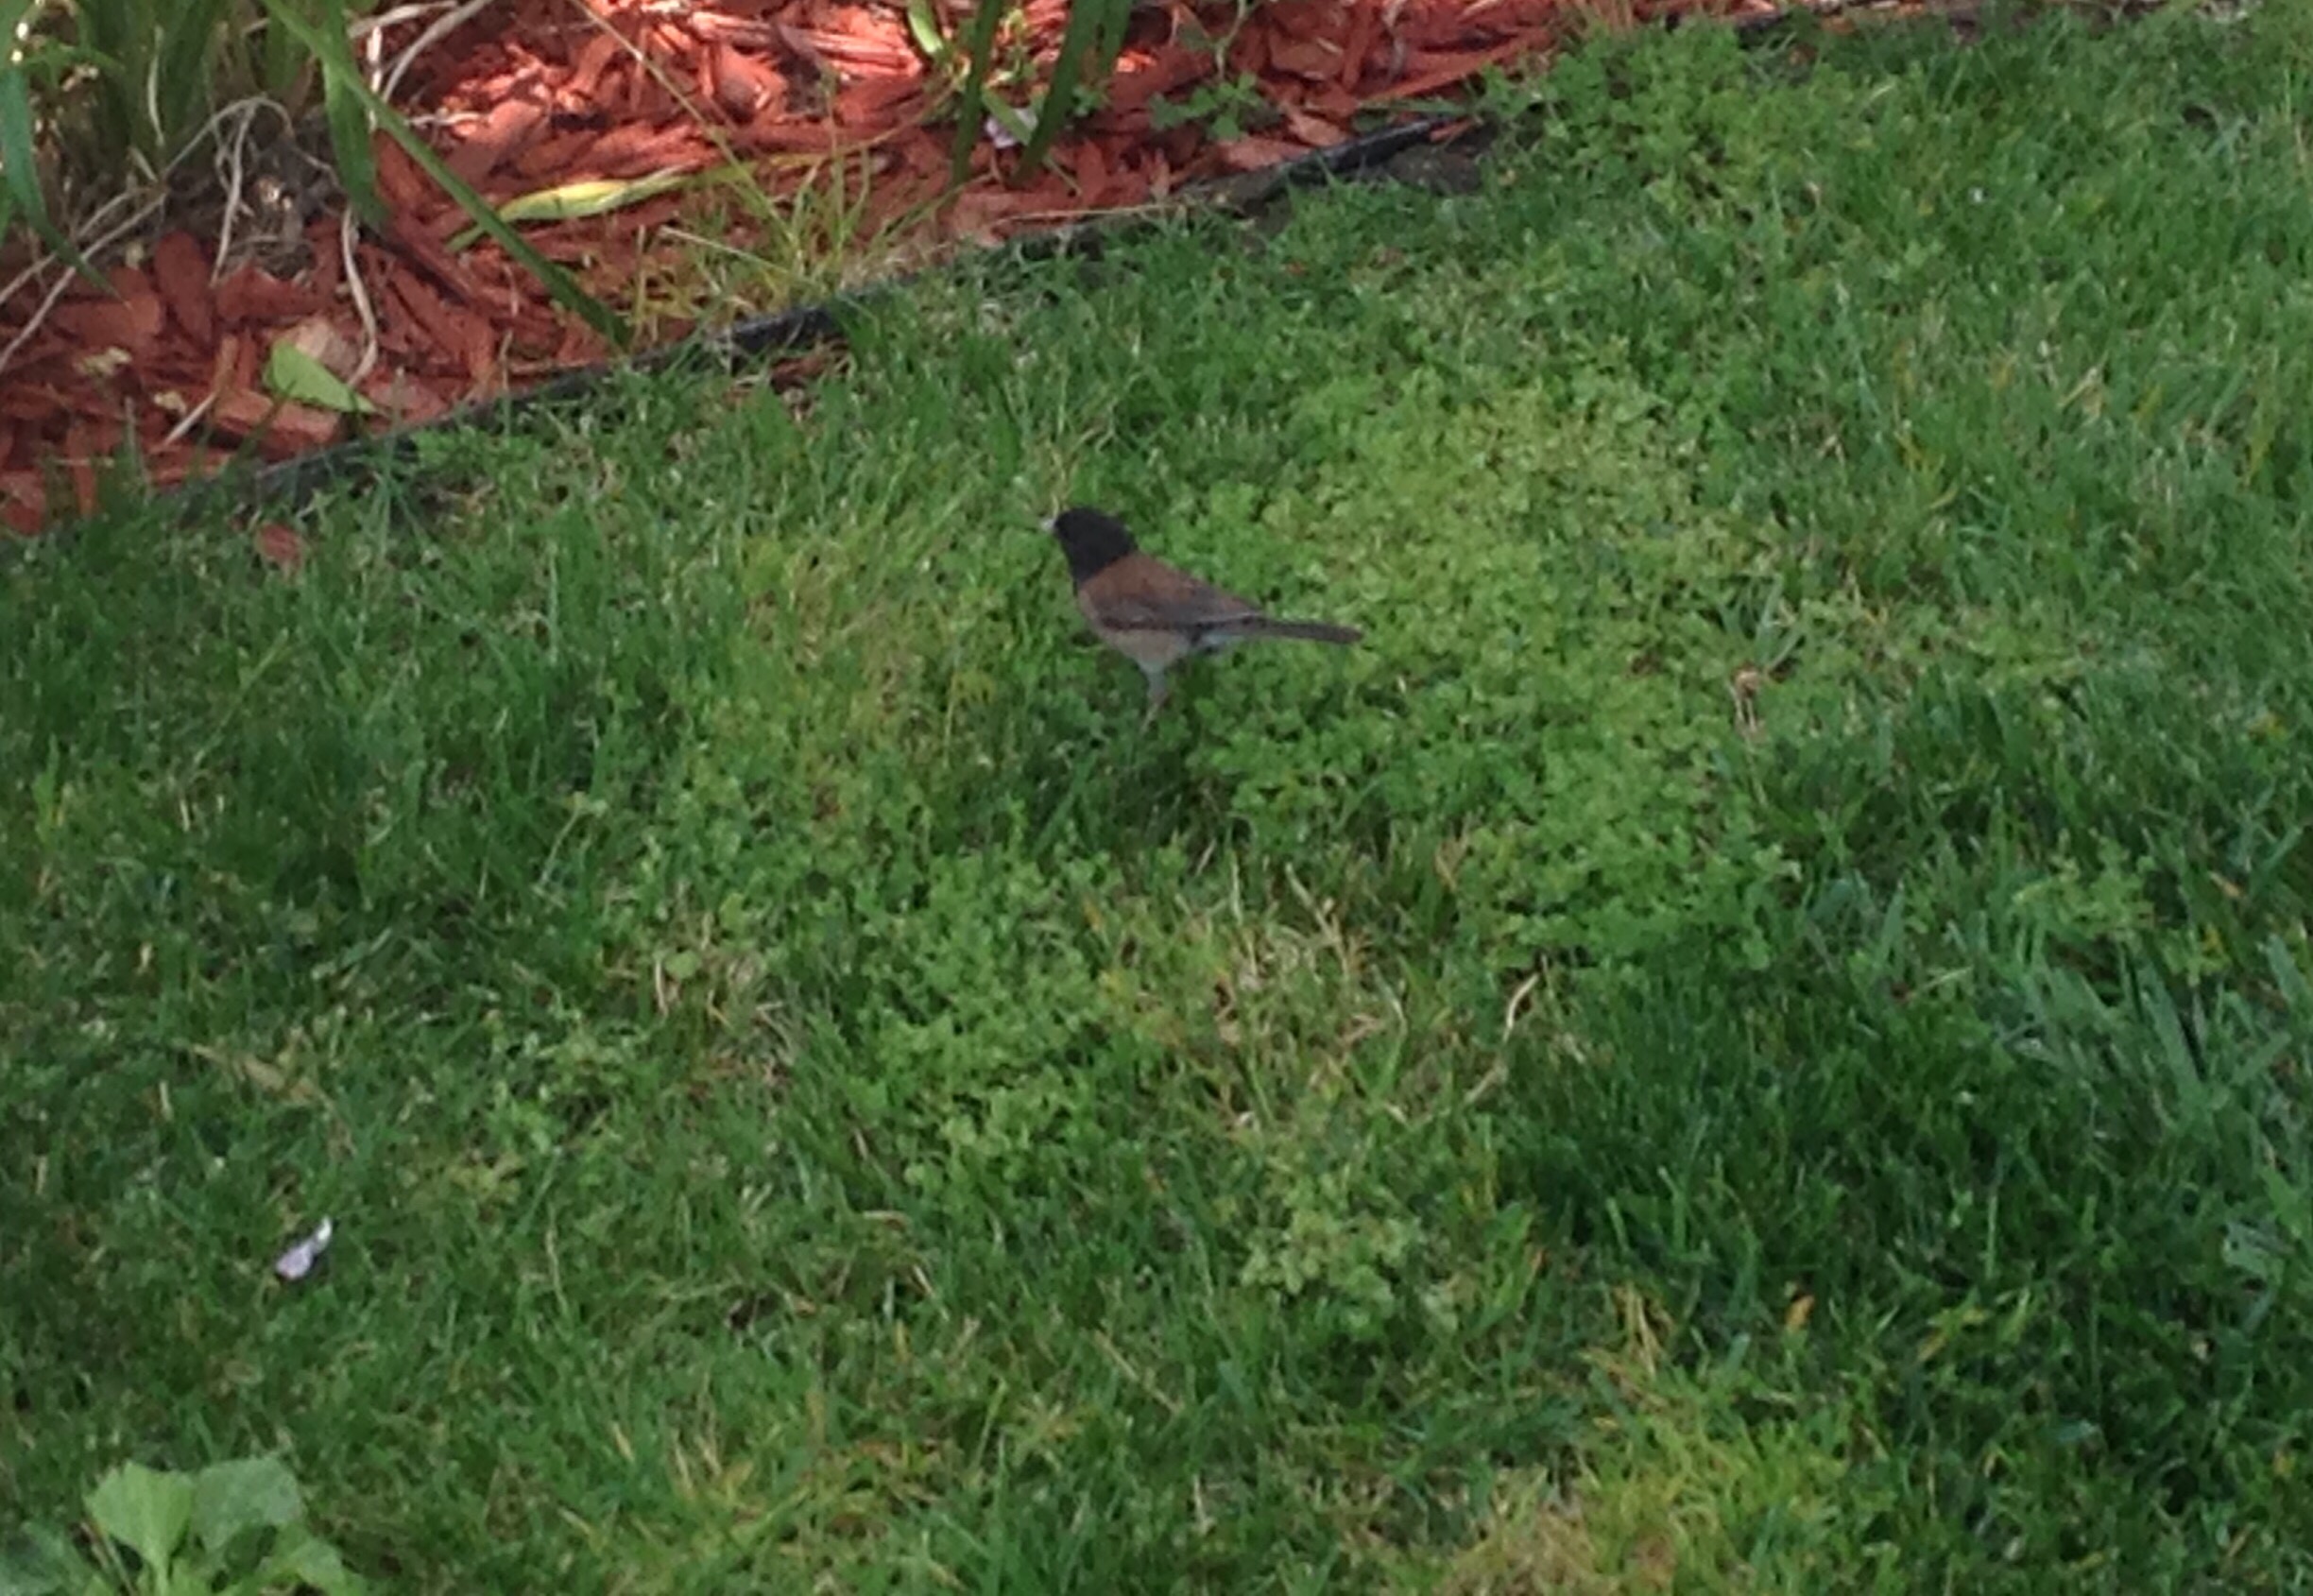
Common name: Dark Eyed Junco
Scientific Name: Junco Hyemalis
As seen in Figure 18, a Dark Eyed Junco, a seed eating herbivore rests on the lawn behind Sobrato and the Robotics Lab. Characterized by a patch of black on their head and around their eye, the Dark Eyed Junco lives across North America. The Dark Eyed Junco can be found through campus, yet this bird was found behind Sobrato.
Figure 19:
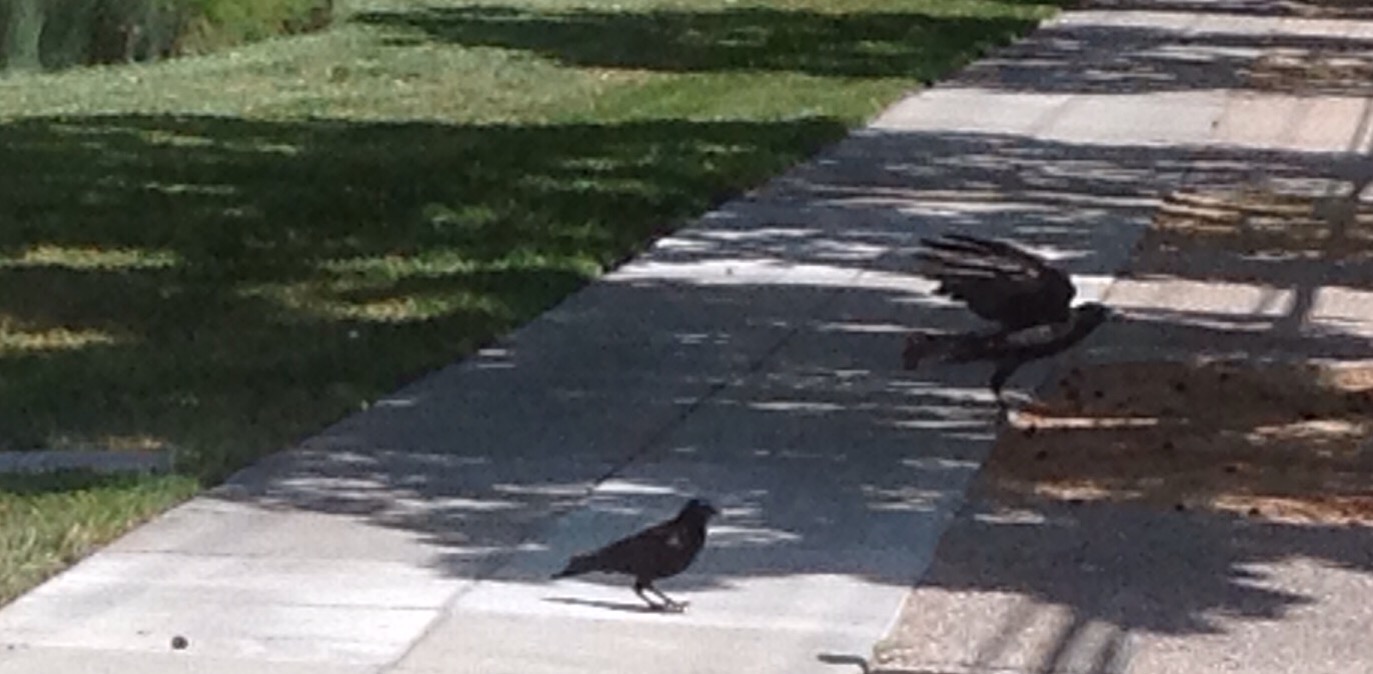
Common Name: American Crow
Scientific Name: Corvus Brachyrhynchos
As seen in a figure 19, an American Crow (Corvus Brachyrhynchos) reads itself to fly behind Lokey. Common throughout much of North American the American Crow is Ominvorous, eating Incests, carrion, human food, seeds , and nestlings. They are covered in sleek black feathers and can be found around Lokey and Liccardo, where they scavenge for food.
Figure 20:
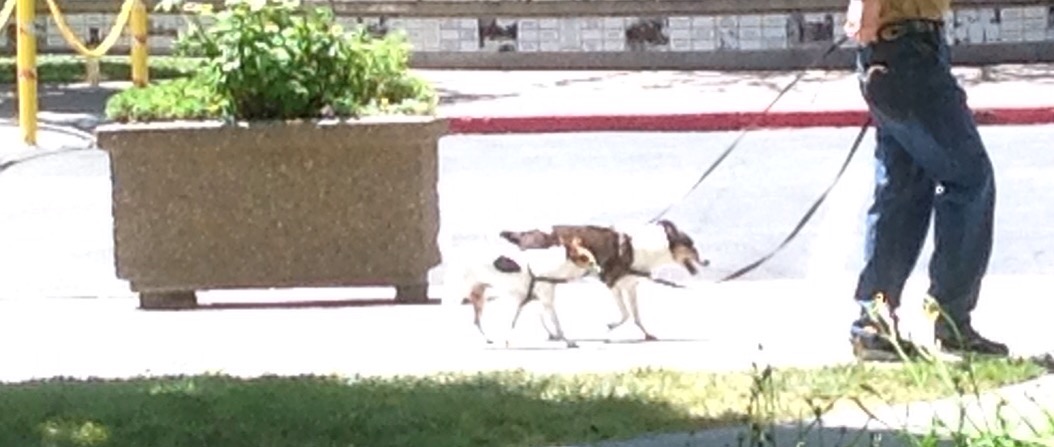
Common Name: Jack Russell Terrier
Scientific Name: Canis Lupus Familiaris
As seen in Figure 20, the Jack Russell Terrier (Canis Lupus Familiaris) is a carnivorous, common breed of the domesticated dog found throughout the world. Jack Russell Terriers, originally used by Englishmen to hunt foxes, are now perform leisurely roles as family pets. Descended from wolves and other canines, dogs possess distinctive sharp tearing teeth and are quite agile. These Dogs where found in front of O’Donnell Hall.
Figure 21:

Common Name: Earthworm
Scientific Name: Lumbricus Terrestris
As seen in Figure 21, the common earthworm (Lumbricus Terrsrtris)squirms on the sidewalk outside Leontyne Chapel. Earthworms are decomposers, turning waste products back into soil. Earthworms are found on every continent except Antarctica, and can be found everywhere at Bellarmine, particularly after a rain storm. This earthworm was found in the garden outside Leontyne Chapel.
Figure 22:
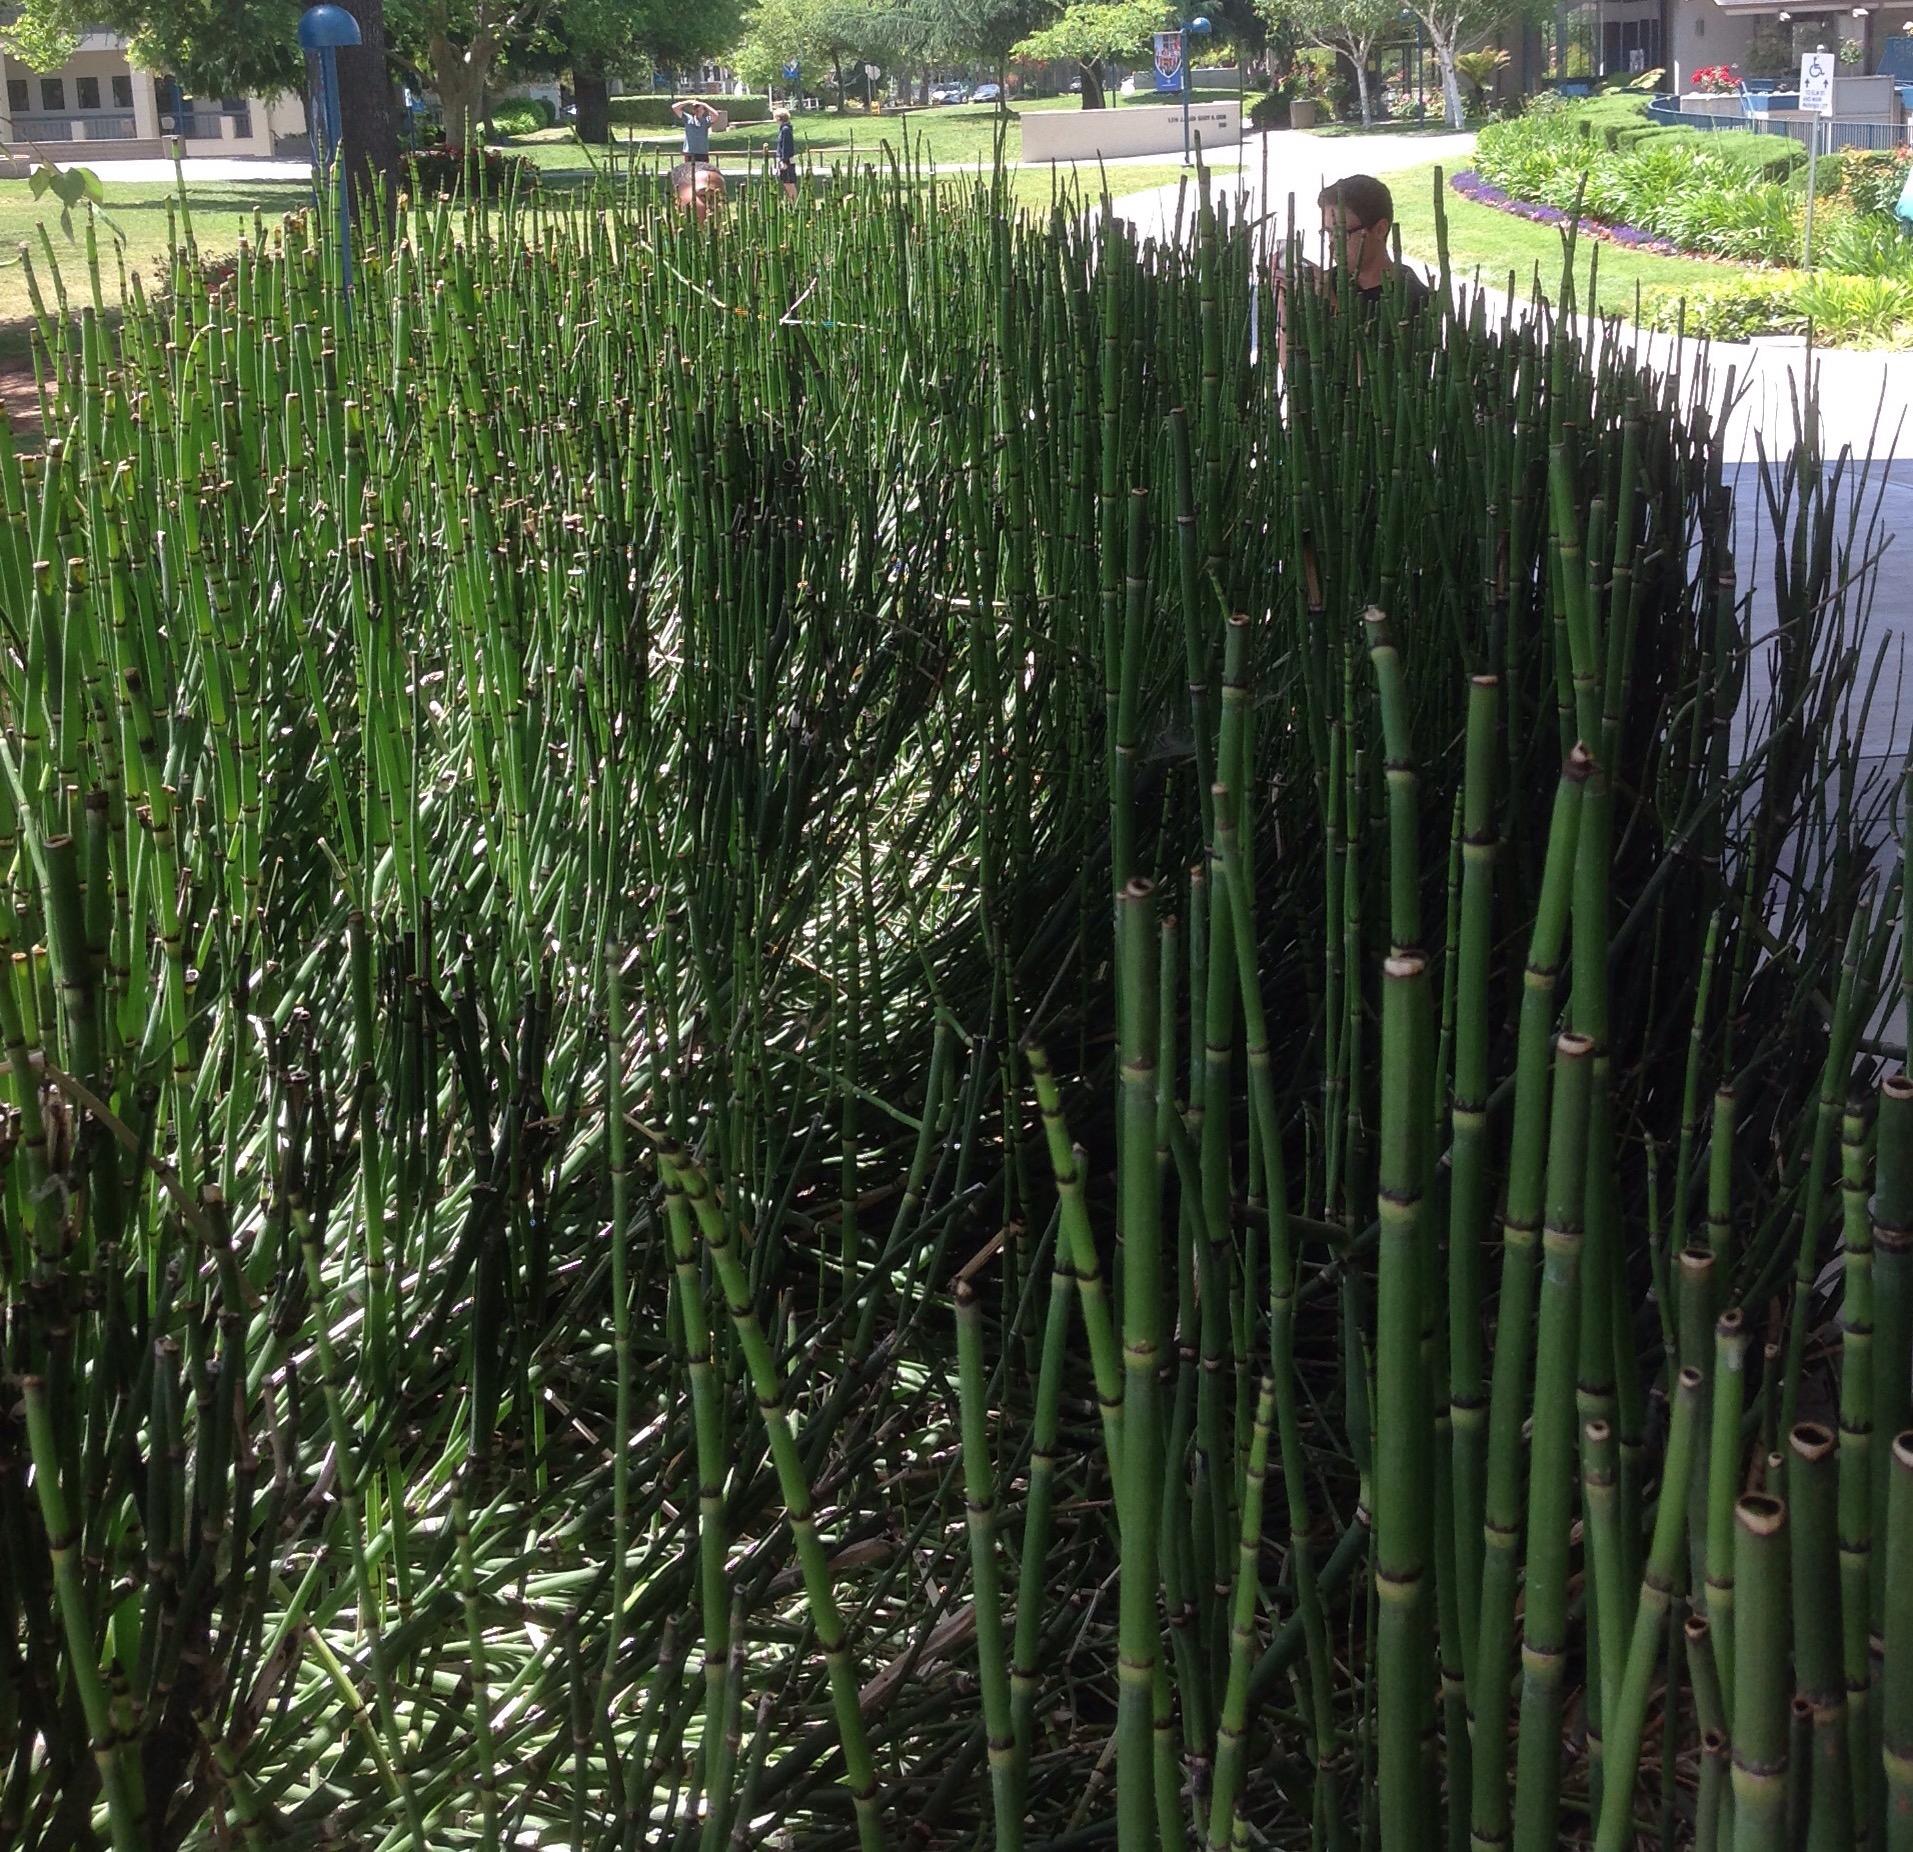
Common Name: Bamboo
Scientific Name: Bambuseae
As seen in Figure 22, bamboo (Bambuseae)a threaten species, grows outside Sobrato. Bamboo is one of the fastest growing plants on Earth, but it is being threatened due to deforestation in the world, particularly in China. Bamboo is found throughout the world in areas with little frost, for the shoots perish in cold weather. At Bellarmine, juvenile and mature bamboo surrounds Sobrato.
Figure 23:
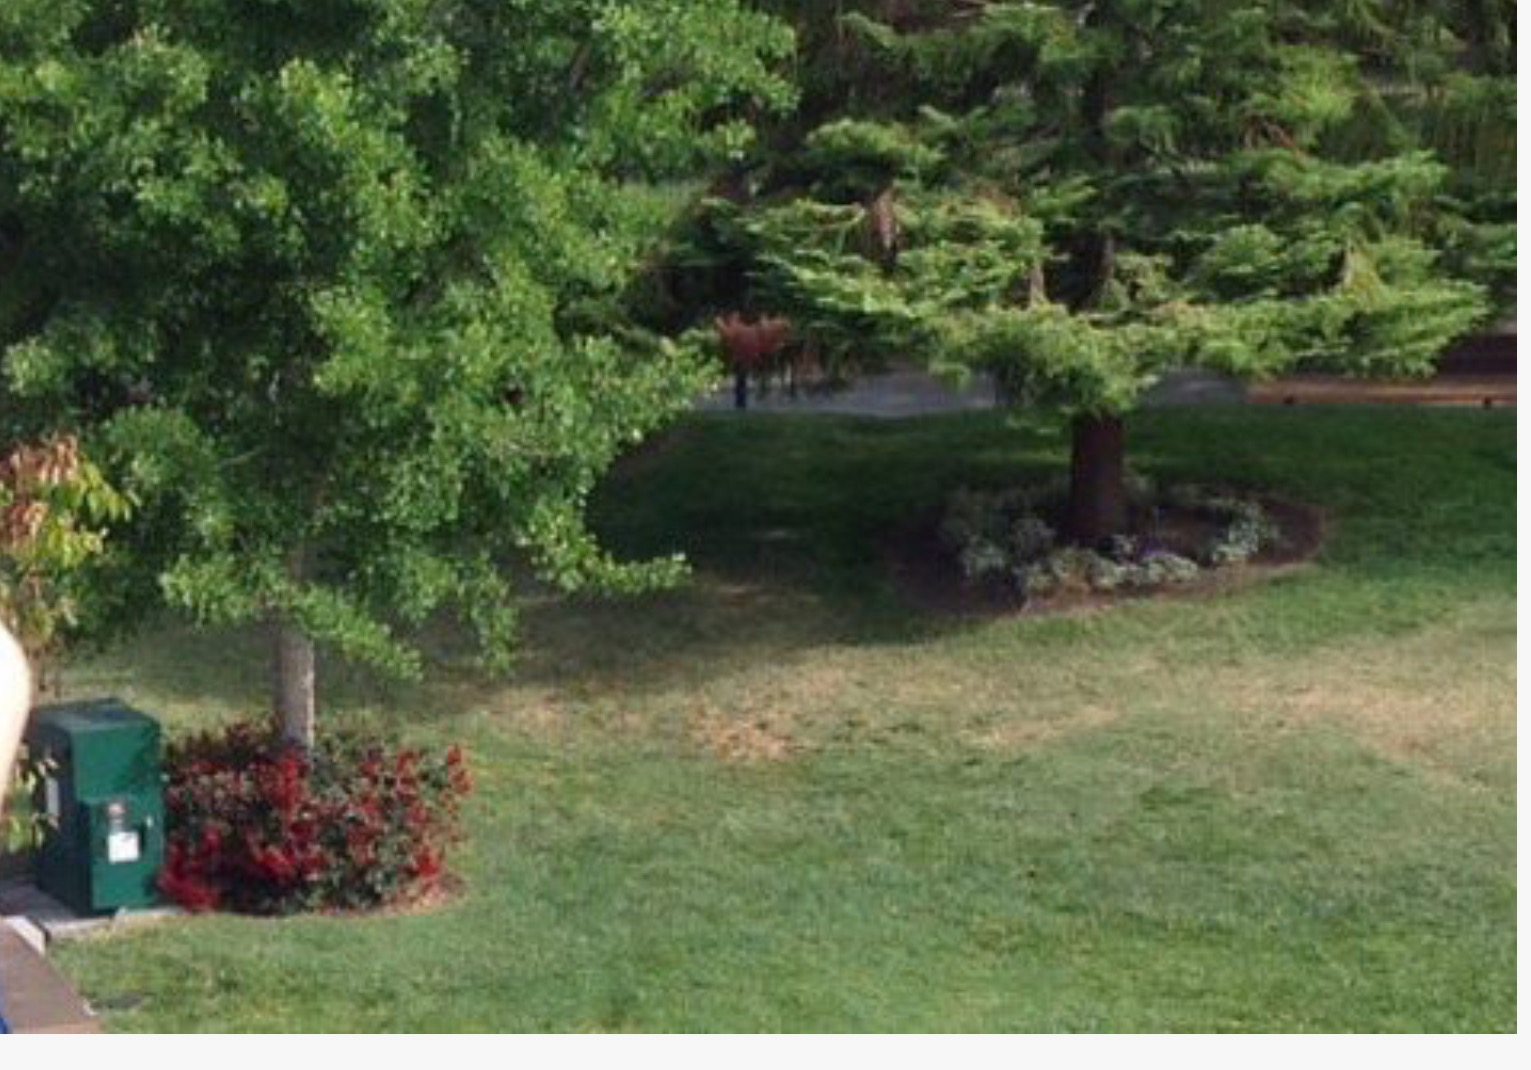
Common Name: Maidenhair Tree
Scientific Name: Gingko Biloba
As seen in Figure 23, the maidenhair tree (Gingko Biloba)an endangered species, grows outside Carney. It is the only species of tree in the division Gingkophyta, an indigenous to China. It is endangered due to deforestation, much like the Bamboo. At Bellarmine, Maidenhair Trees are found outside the front of Carney.
Figure. 24:
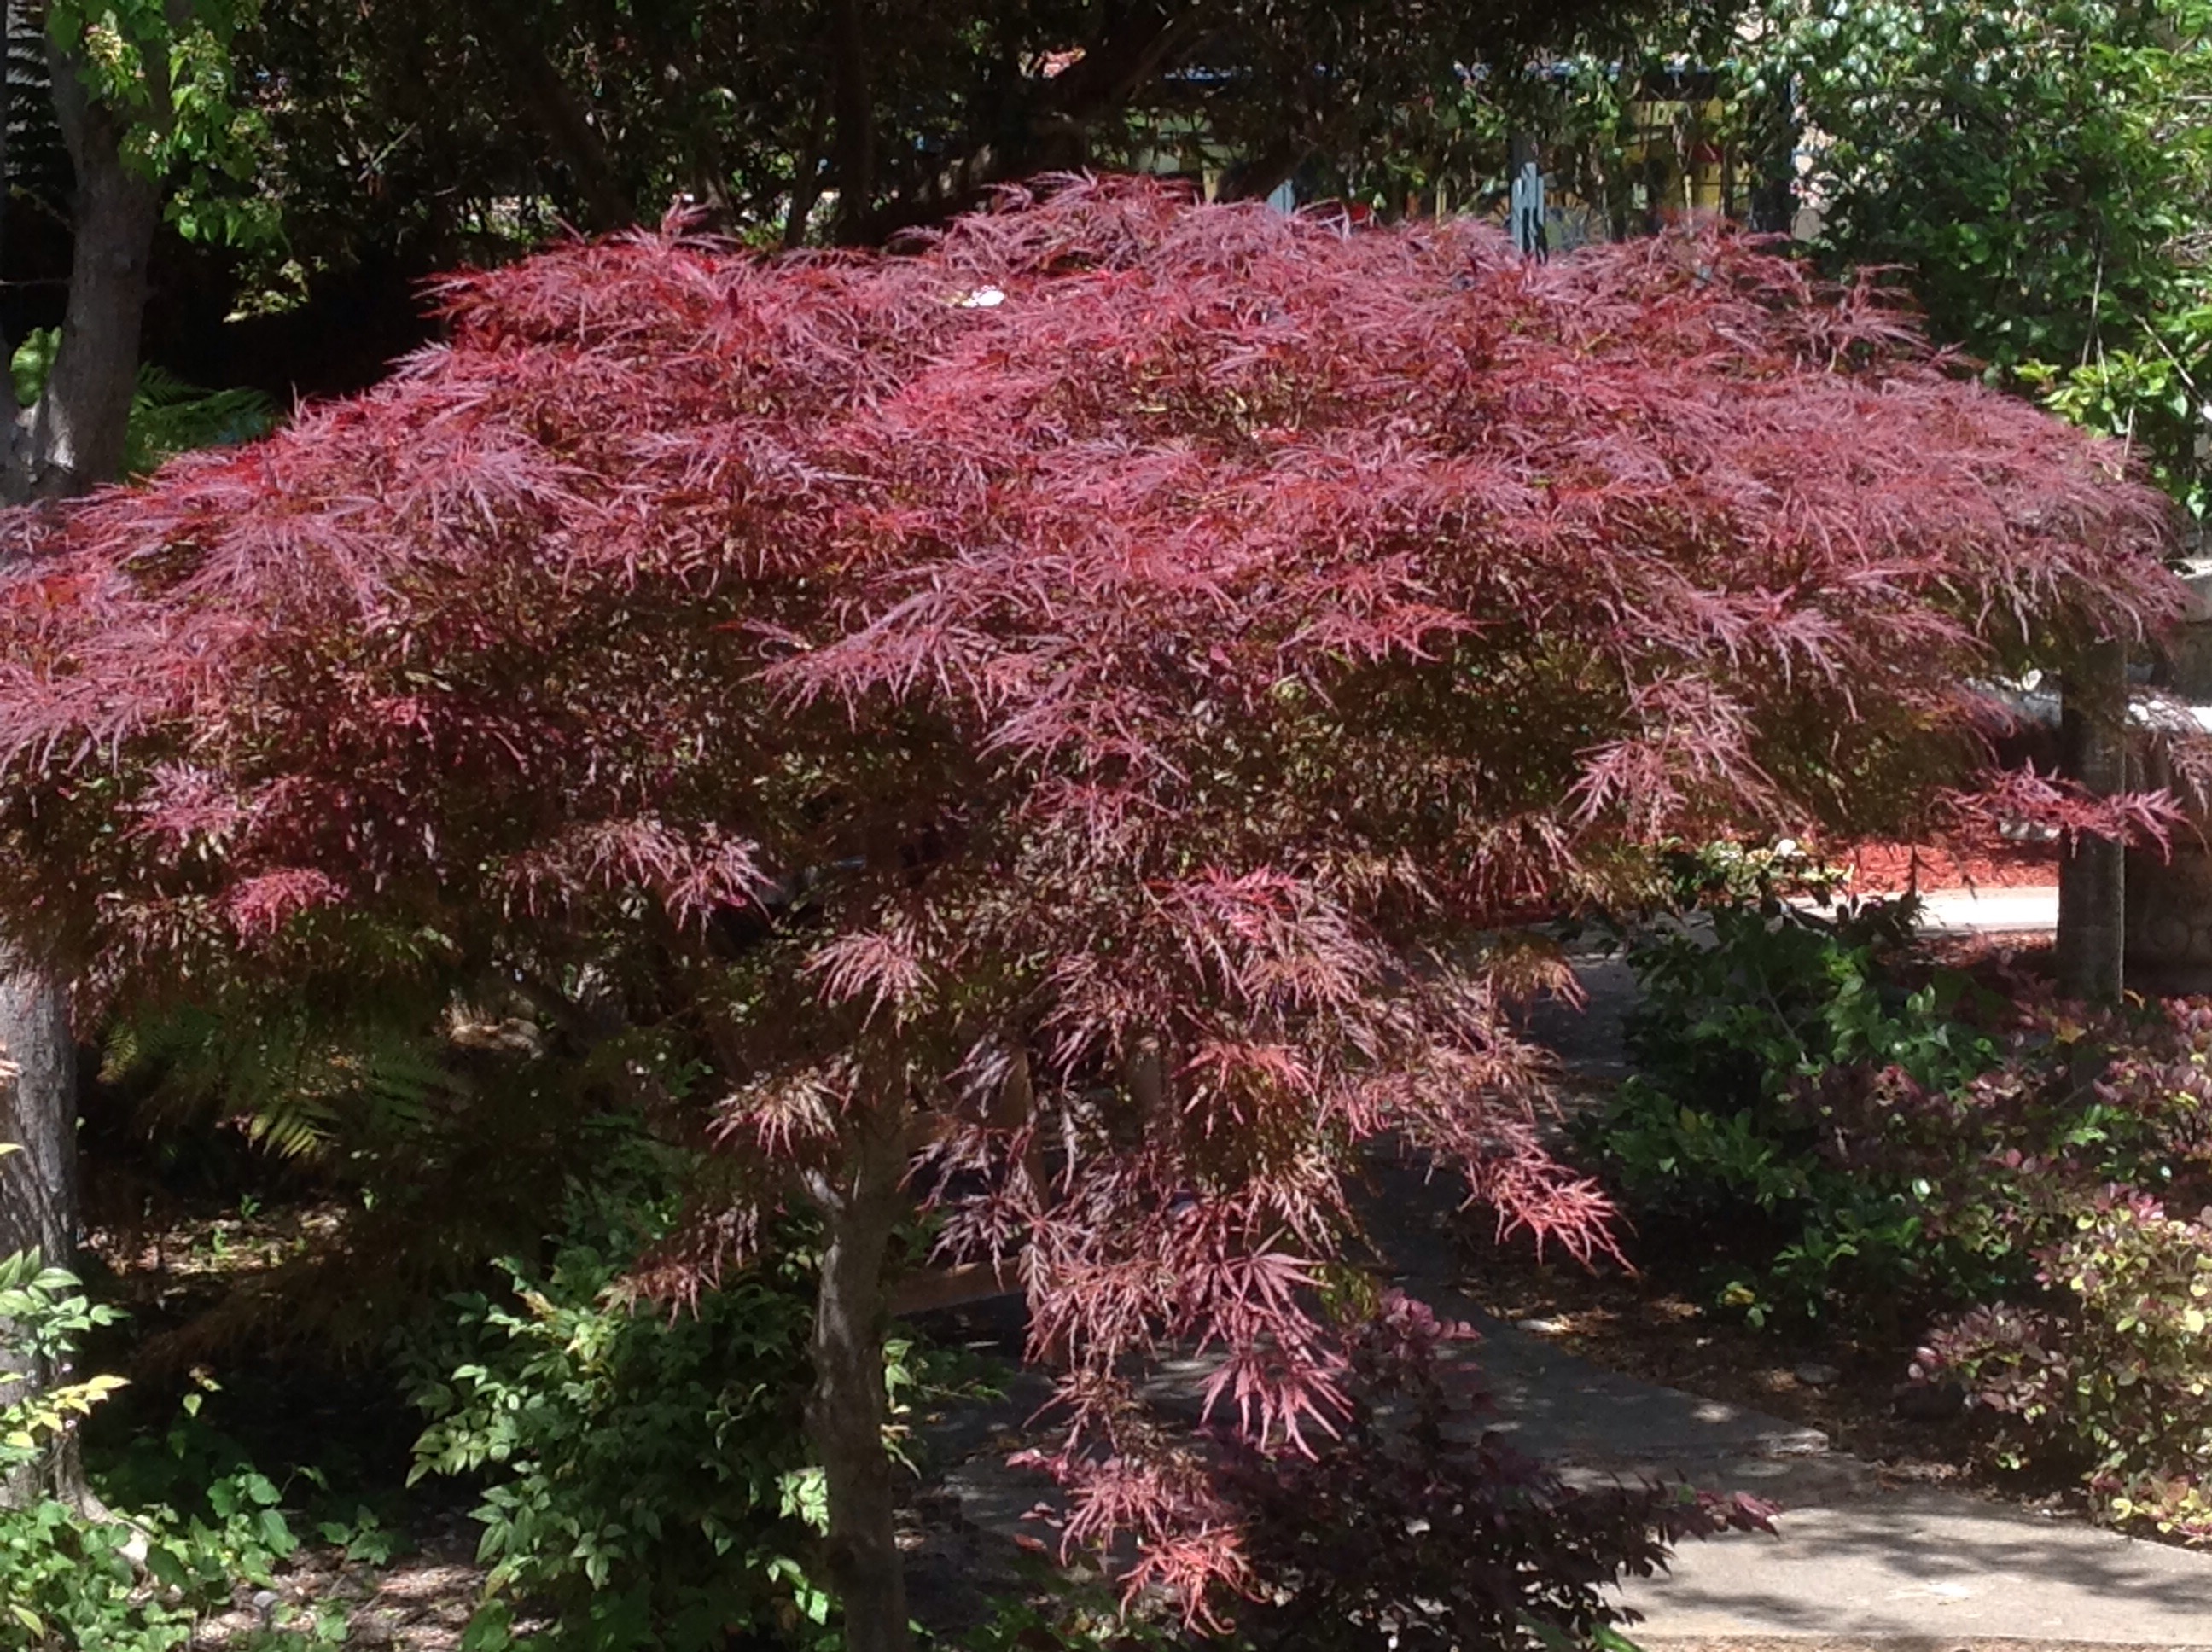
Common Name: Japanese Maple
Scientific Name: Acer Palmatum
As seen in Figure 24, the Japanese Maple (Acer Palmatum)is a non-native species, indigenous to Japan. A deciduous tree, the Maple’s colorful leaves switch from purple to yellow in autumn. At Bellarmine, Japanese Maples are located in front of Carney, the flagpole, and behind Leontyne Chapel, where the maple in Figure 24 is located
Figure 25:
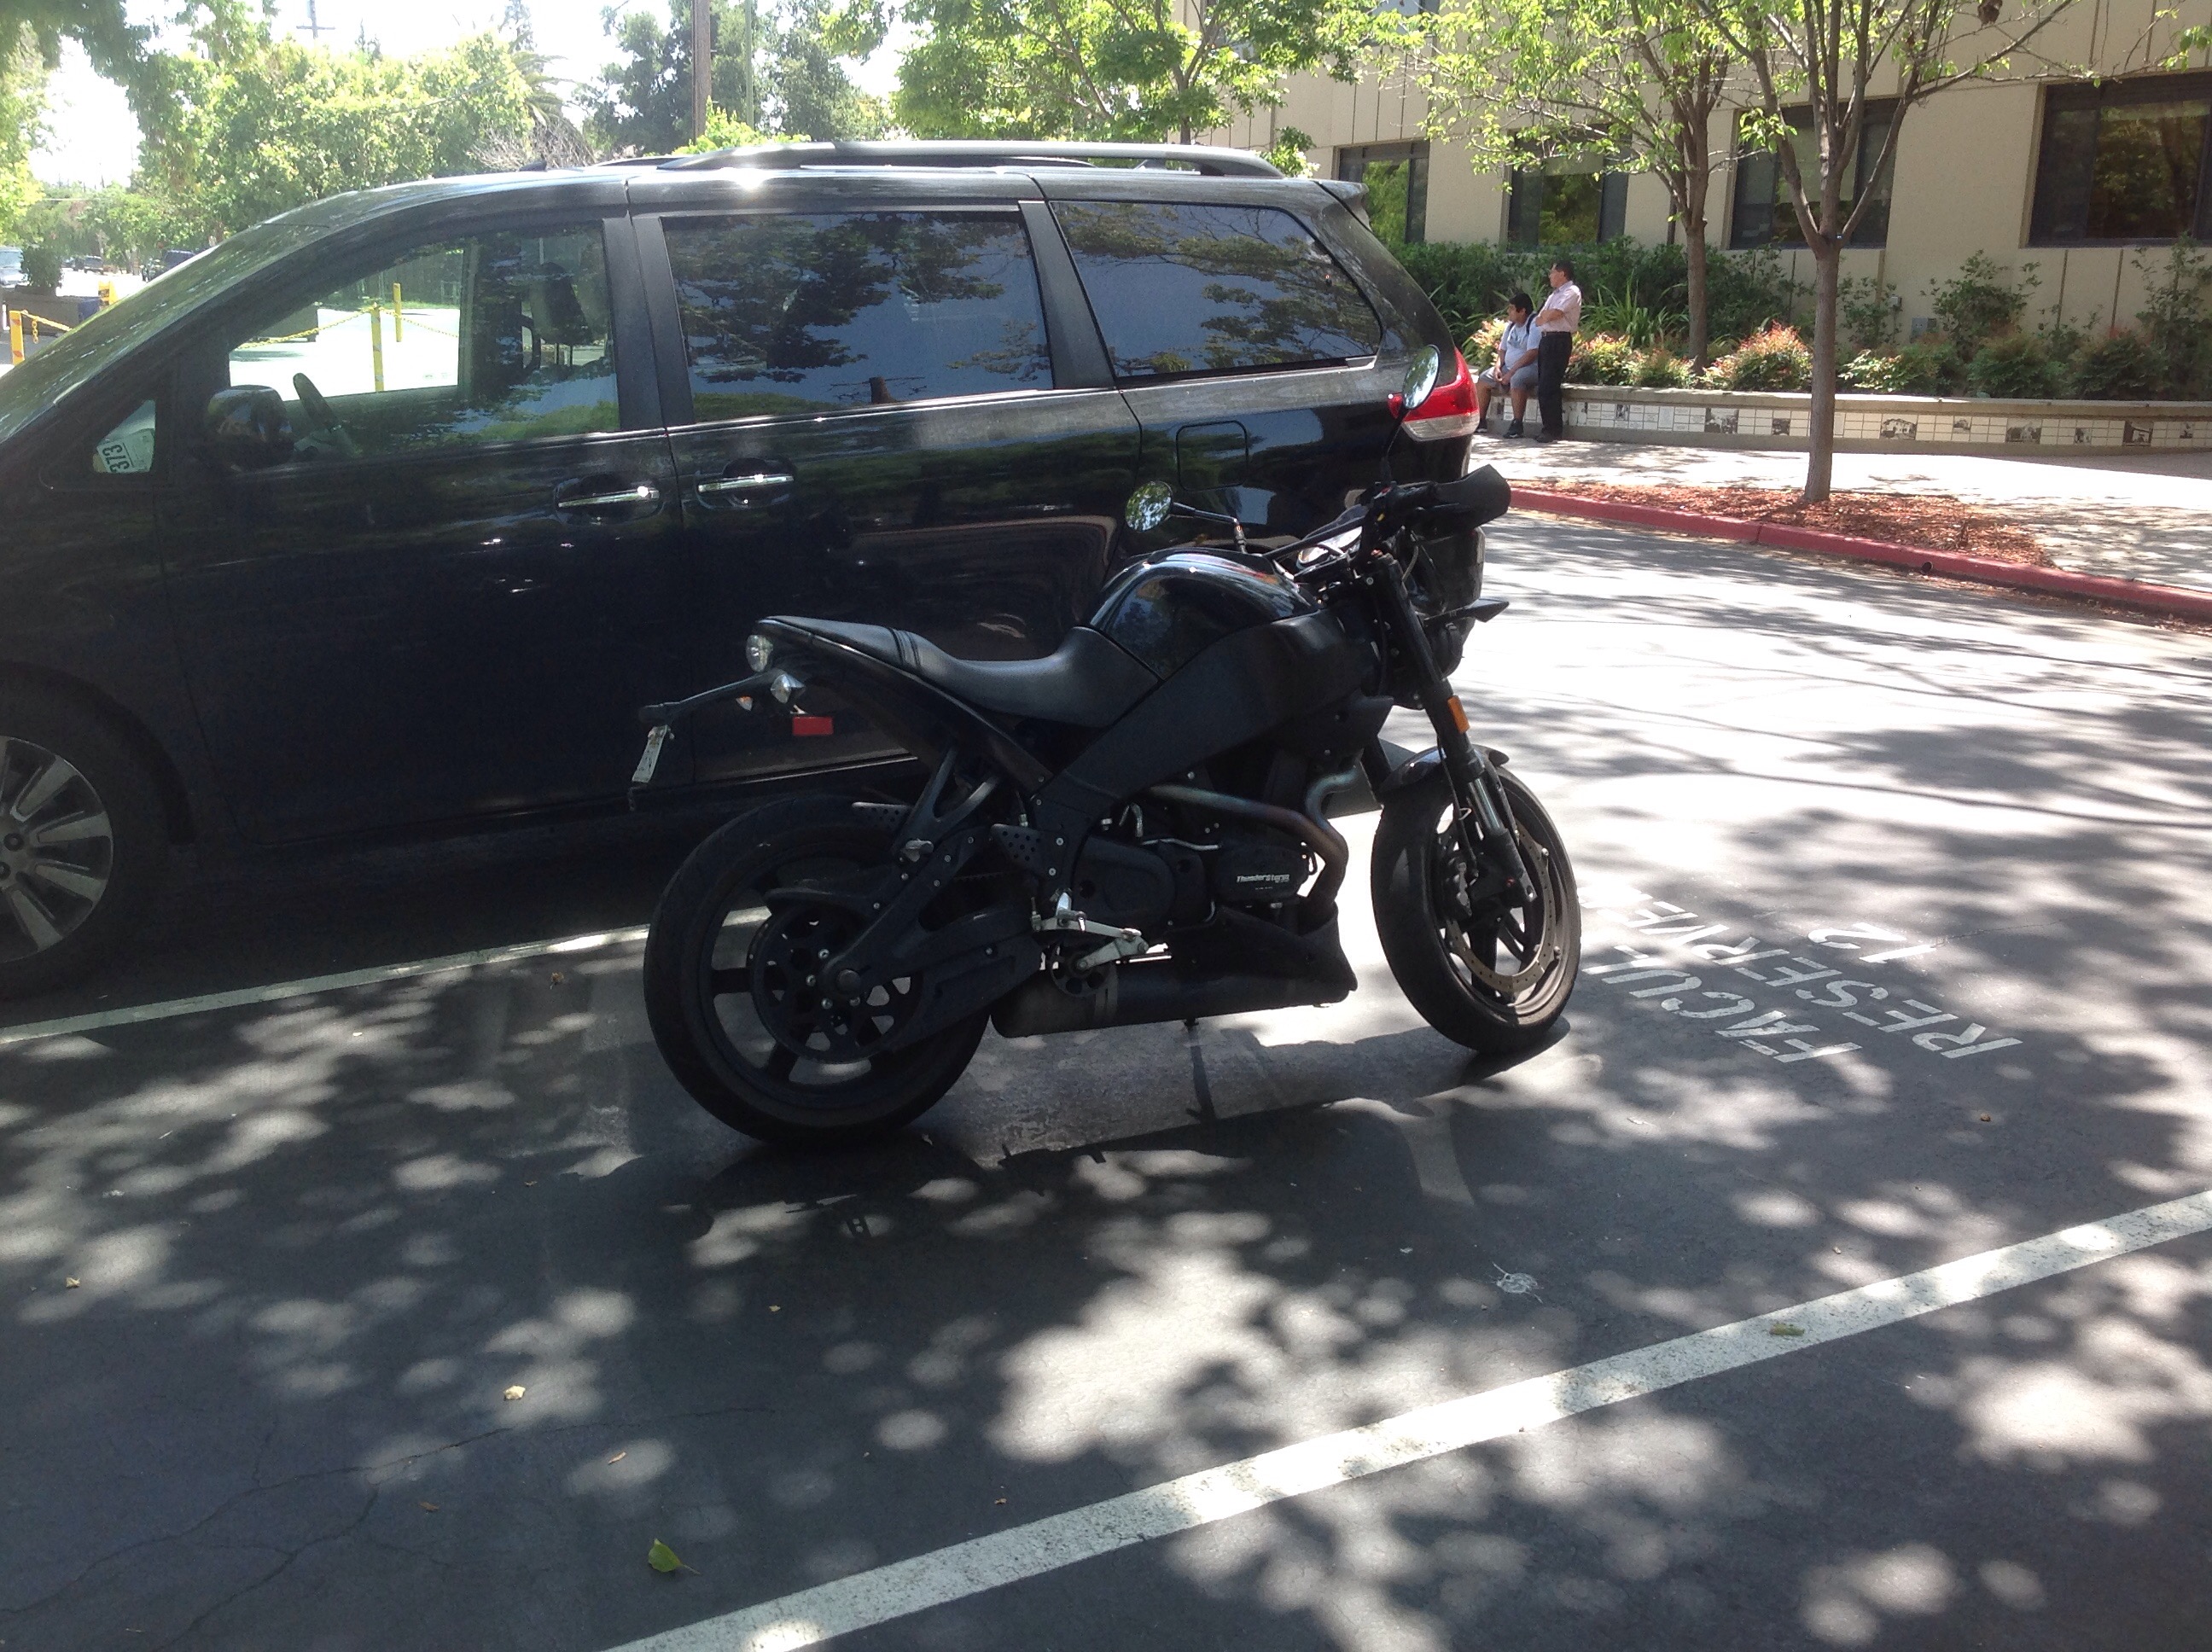
Common Name: Automobile
Scientific Name: —————
As seen in Figure 25, automobiles, a motorcycle and a car are pollution sources found at Bellarmine. Exhaust produced by these vehicles cause air pollution, thickening the ozone layer. Motorcycles and cars can be found surrounding campus in the numerous parking lots. Also, numerous golf carts drive through the quad, further emitting pollutants into the air.
*Define and differentiate between ecology and environmental science and discuss the Bellarmine campus in the context of both.
Ecology is the study of the interactions of the populations, communities, and ecosystems of organisms to their environments on Planet Earth, while Environmental Science is the study of the environment of organisms and the study of interactions among physical, chemical, and biological aspects of the environment. An organism’s environment includes both abiotic factors such as sunlight, climate, and rainfall, as well as biotic factors (other organisms that share its environment). While ecology focuses mainly on the physical aspects of nature and the interactions of organisms, environmental science focuses on the chemical and biological aspects as well, examining human affects on the environment, like pollution and deforestation. At Bellarmine, we have an ecology of the biotic and abiotic factors that call campus home, with animals being suited to possess a niche in the Bellarmine environment. The affects of humans at Bellarmine, as seen with students leaving trash on the ground and stepping on the plants effects the organisms in the Bellarmine ecosystem, an example of environmental science.
*Define and describe any population, community, ecosystem, biome and aquatic zone that you find on campus; and discuss the biotic and abiotic factors that contribute to that ecosystem.
A population a group of organisms of the same species that interact with one another, while a community is a group of organisms in a common habitat that interact with one another. On example of a population on campus is the number of Dark Eyed Juncos that congregate on the grass to feed, while an example of a community is the Juncos, Rock Doves, and Crows that interact with each other in their competition for food. An ecosystem is a community interacting with both additional biotic and abiotic factors. For example the Juncos, Rock Doves, and Crows, interact with other biotic factors, such as humans, predatory felines, and their prey, incests and plants. They also interact with abiotic factors, including the climate, rainfall, which would prohibit them from flying, obstacles, such as telephone wires, and sunlight. A biome is a group of ecosystems having similar abiotic conditions. At Bellarmine, we live in a biome comparable to a Chaparral. A Chaparral is a dry temperate forest, similar to the biome of the Mediterranean. The chaparral possess numerous scrubs (as seen in Figure 11 above) and has plants with large leaves and animals associated with deserts and forests, such as coyotes, deer and jack rabbits. Although there are not such large animals on campus, numerous shrubs and other chaparral organisms including Juncos and Rock Doves dot Bellarmine’s campus. Furthermore, abiotic factors including similar !editerranean weather conditions are common between the Chaparral biome. This can be seen comparing Bellarmine’s campus to the ecosystem further North in Los Altos or Palo Alto, as well as abroad in the Mediterranean foothills. Aquatic Zones are biomes of water ecosystems, such as that of the San Francisco Bay Estuary. Although we do not have many aquatic zones on campus,masked from perhaps a teacher’s fish tank, a major aquatic zone is the San Francisco Bay. With the biotic algae and kelp, otters, fish, and grey whales interacting with the abiotic water salinity, temperature, and depth, these factors encompass the ecosystem of the Bay.
*Construct and discuss a food chain, a food web, and an ecological pyramid based on the trophic levels that you observe.
In an ecosystem, food chains play an major role in the interactions between organisms. Predation, one of the most important relationships between species is described in a food chain. A food chain at Bellarmine is depicted in Figure 26.
Producer: Orange Tree->Primary Consumer:Ants->Secondary Consumer: Rock Dove-> Tertiary Consumer: Tabby Cat.
Figure 26:
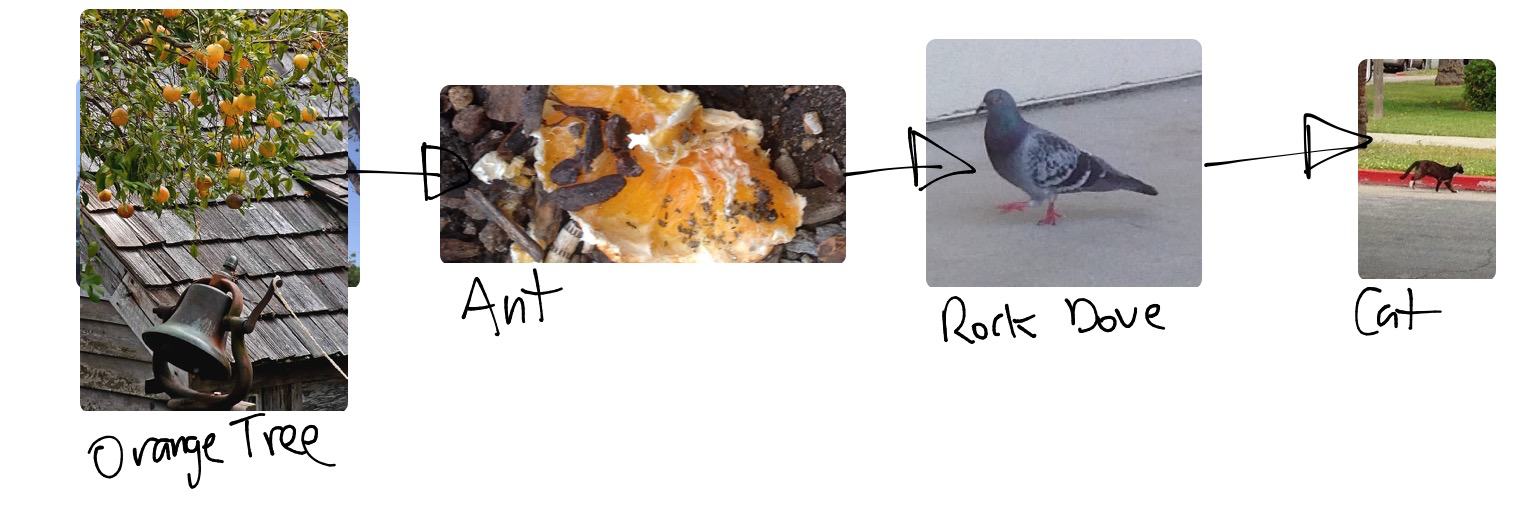
A food chain describes the who-eats-who in an ecosystem, following the path of nutrients in the ten percent rule. As a predator increases per tropic level, only ten percent of the nutrients from the prey is obtained. This allows for there to be more primary consumers than tertiary consumers, for the latter only receive 1% of the energy stored by the primary consumer. Organisms are grouped into tropic levels, divided into producers, consumers, and decomposers. Producers are photo autotrophs and produce their own food via photosynthesis, yet consumers must obtain food by consuming another organism. Consumers can be herbivores (primary consumers), omnivores, or carnivores. Decomposers rid of the waste and carrion and turn it into soil. In the Bellarmine Food Chain, the Orange tree and Palm tree are producers, the Ants are primary consumers, the secondary consumers are the Rock doves, and the tertiary consumers are the tabby cats.
Food webs are the interconnection of food chains for an entire ecosystem as opposed to a food chain, demonstrating a single chain for a community. A Bellarmine Food Web is depicted in Figure 27, with Palm trees and roses as consumers, bees, ants, and Jercos as primary consumers, crows and pigeons as secondary consumers, and dogs and cats a tertiary consumers.
Figure 27:
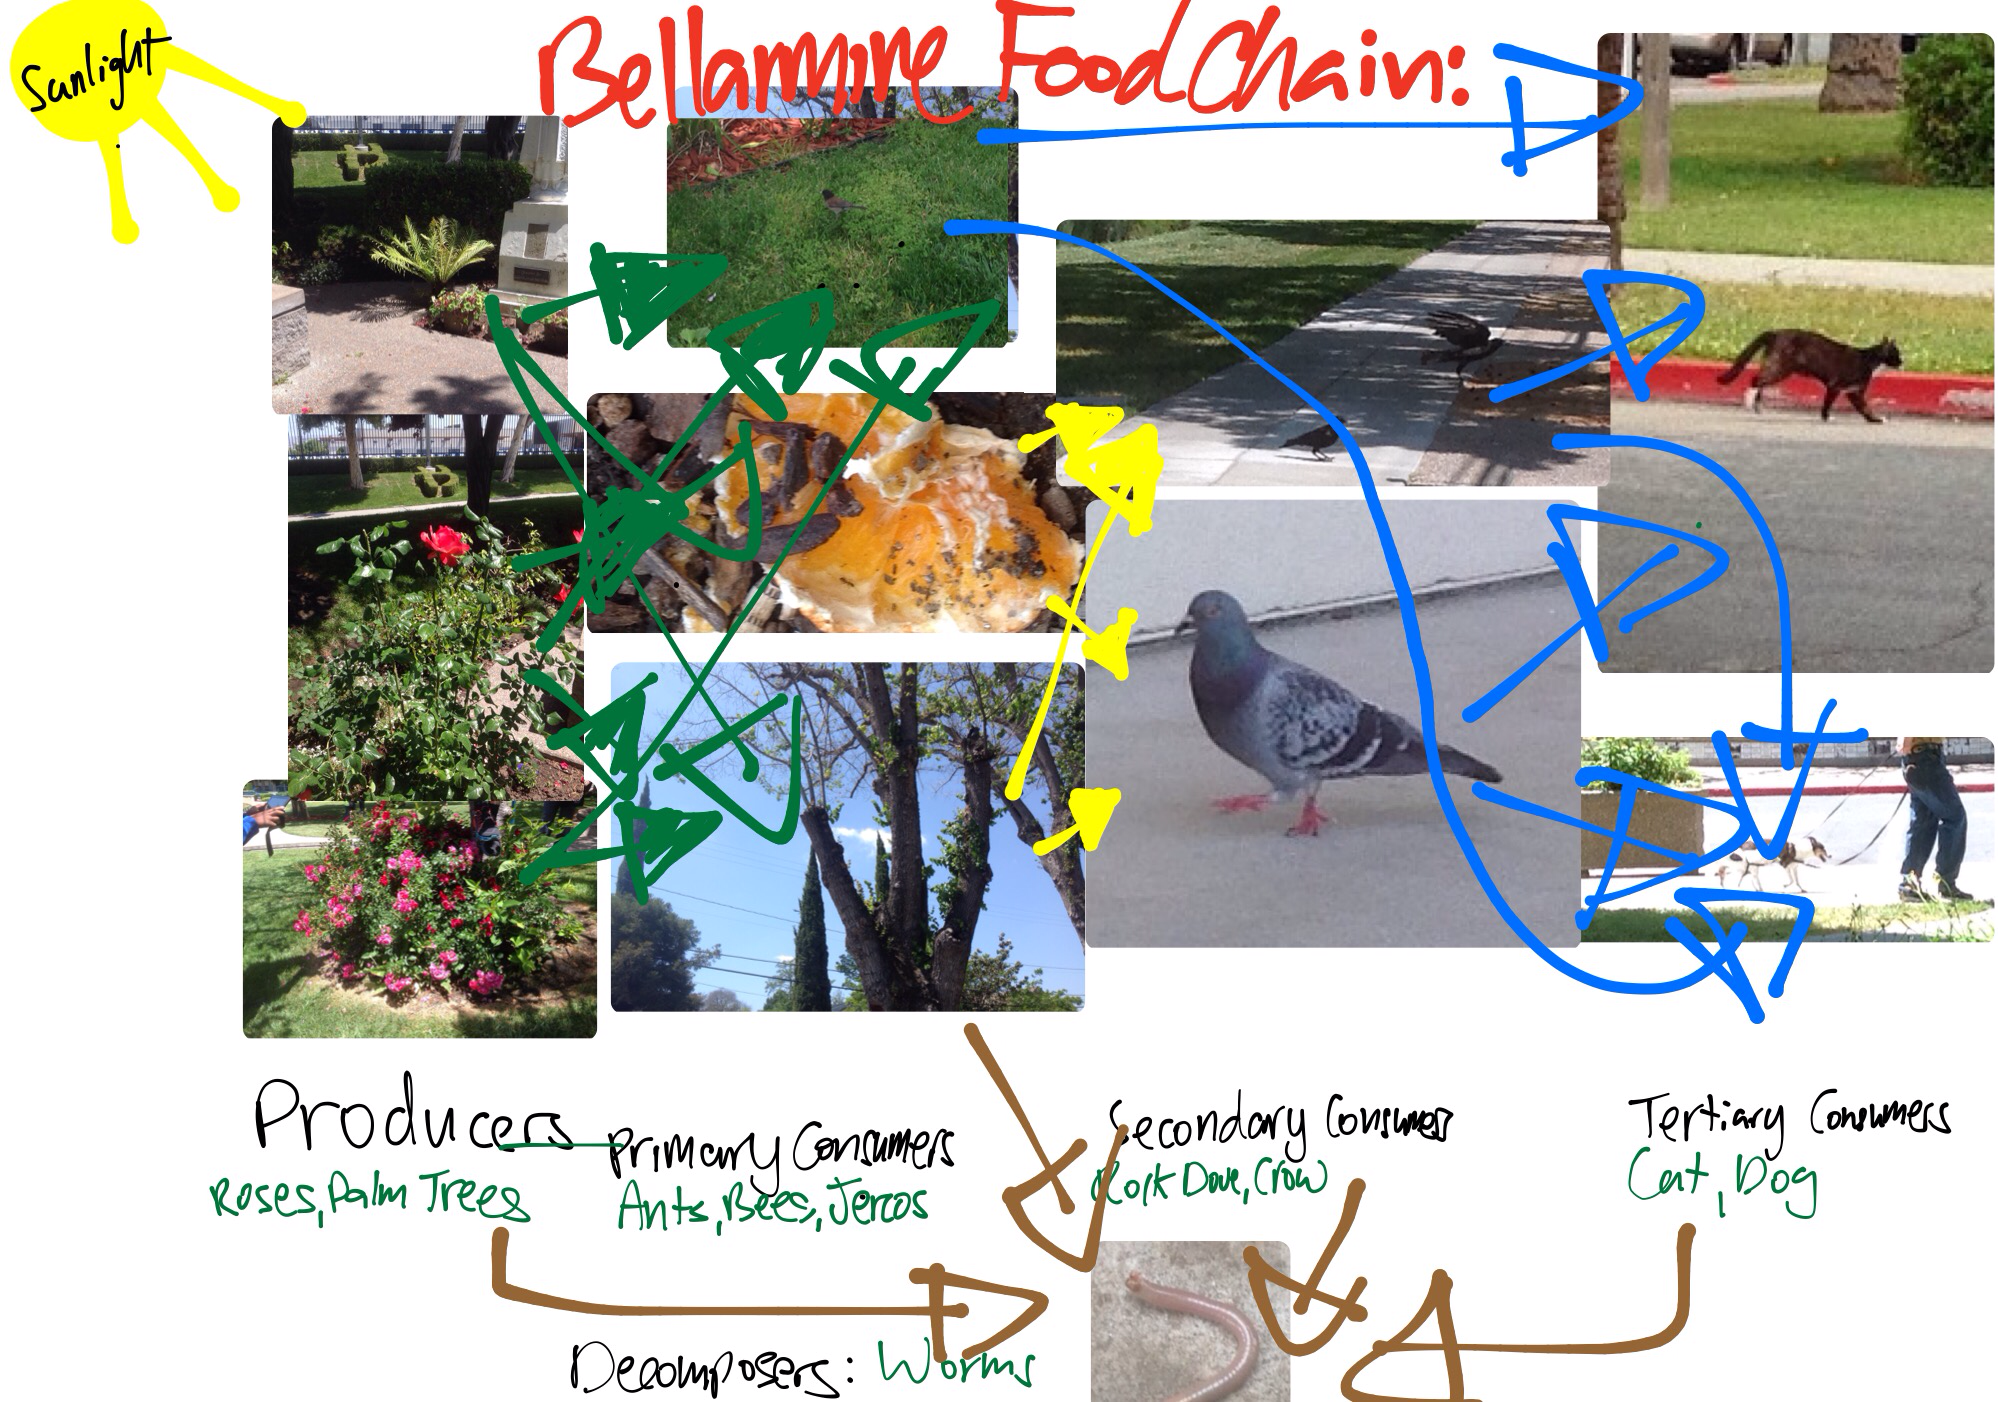
Figure. 28
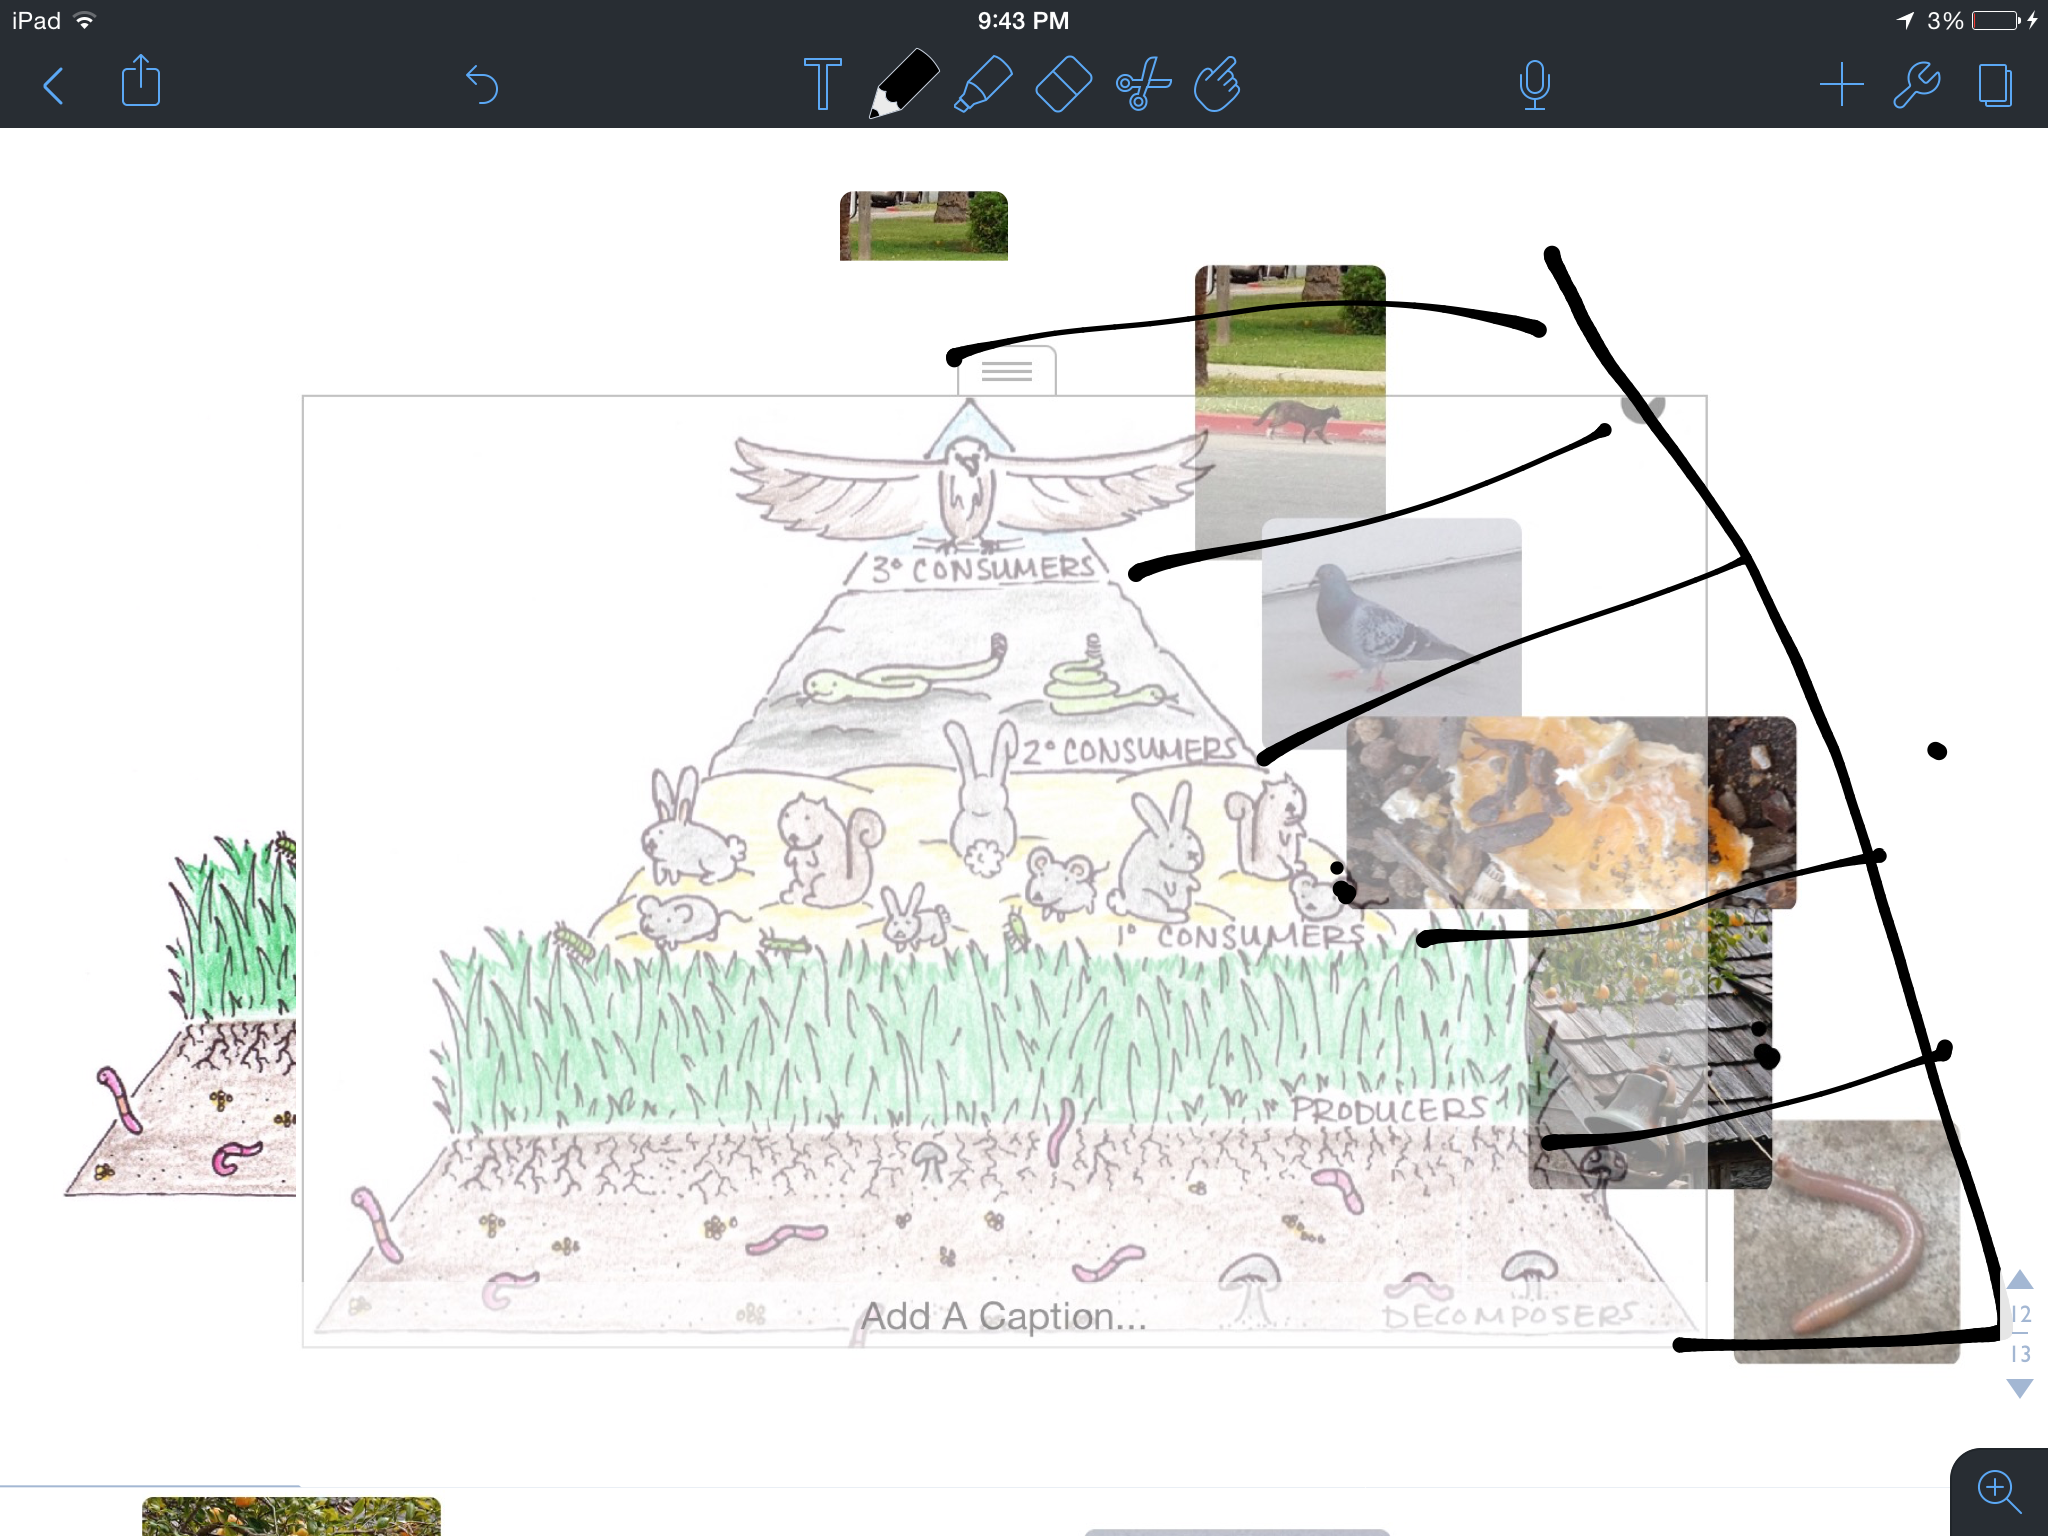
As seen in Figure 28, the trophic levels of animals in Bellarmine’s ecosystem is compared to that of a chaparral.
Trophic Levels are several levels of hierarchy grouping organisms that share the same function and diet in a food chain. For example, at Bellarmine, both cats and dogs are tertiary consumers, for they both can eat birds, such as Rock doves and crows. Rock Doves and Crows are also on the same secondary consumer trophic level, for they both eat herbivorous incests and are eaten by similar animals.
*Investigate and discuss any endangered, threatened, and invasive species on campus.
Endangered species are organisms at risk of going extinct because of climate change, human activity, and predation, while threatened species are organisms at risk of going extinct to a lesser extent of endangered species. At Bellarmine, the endangered Maidenhair Tree, is located outside of Carney. As Gingko Biloba is the only member of the clase Gingkophyta at is not extinct, Maidenhair trees are classified as endangered. The plant has been used in traditional medicine and in culinary applications, and is subject to deforestation, endangering its existance on the Earth. Also at Bellarmine, bamboo, is a threatened species, also due to deforestation. Bamboo is harvested for many practical purposes and bamboo forests are being cleared worldwide for architectural and agricultural purposes. The elimination of bamboo forests has led to the threatened classification for bamboo, as well as similar classifications for animals that feed on bamboo, including giant pandas. Invasive species are organisms not native to a region that dominate over local communities. One example of a non native species at Bellarmine is the Japanese Maple. Originating in East Asia, the Japanese Maple has taken root across Bellarmine, dominating several flowerbeds, in its non-native habitat. Other invasive species include Burmese Pythons in Florida, African Killer Bees in the United States, and Zebra Quagga Mussels in the Great Lakes.
*Define pollution, and describe and discuss the various types that you observe on campus.
Pollution is the introduction of contaminants into the atmosphere that having an detrimental affect on the a Earth. Pollution comes in numerous forms: air pollution, water pollution, and land pollution, all of which were apparent at Bellarmine. Air pollution is the build up of substances in the atmosphere that can produce adverse affects on living matter. Major sources of air pollution include powerplants, transportation, and burning of solid wastes. The major types of air pollutants include carbon monoxide, hydrocarbons, nitrogen oxides, particulates, sulfur dioxide, and photochemical oxidants. At Bellarmine, examples of air pollution include noise pollution from the airplanes going to San Jose Norman Mineta Airport, the exhaust from the motorized vehicles (As seen in figure 29) at Bellarmine, and the large power generator near the robotics lab. Air pollution further fuels global warming, for greenhouse gases emitted in forms of air pollutants trap the sun’s energy, warming the Earth.
Figure 29:

Water Pollution is the contamination of groundwater, lakes, rivers, and oceans. Water Pollution can be deadly to humans, as contaminated water kills over 14,000 people daily. At Bellarmine, water pollution can be found in the usage of chemicals outside as pesticides, that when washed down the drainpipes contaminate the water sources of various organisms. Land Pollution is the degrading of land directly resulting from man made activities. At Bellarmine, fertilizers damage the soil used to grow plants, and littering pollutes the ground with trash. Other examples of air pollution include Mercury deposits from mining expeditions and the usage of DDT in the early to mid 1900s.
If I were to do this experiment in the future, I would compare the ecosystems of other nearby schools, to see if slight differences in loaction had an adverse affect of communities.furthermore, I would examine and contrast different areas of the school, to compare how abiotic factors had an affect on plant growth, such as sunlight allowing plants to grow taller.
Works Cited:
Oregon State University Mathematics:

University California Clermont Ecology
http://biology.clc.uc.edu/courses/bio303/history.htm
Toledo University Ecology
http://www.eeescience.utoledo.edu/Faculty/Heckathorn/EEES%202150/Lecture%2018%20-%20ecology.ppt
Stanford University Ecology
http://plato.stanford.edu/entries/ecology/
EO Wilson’s Life On Earth Book 7
National Geographic