In this lab, I used Indian Corn to explore Mendelian Genetics, Independent Assortment, and Chi Square Analysis. During the lab, I counted and classified the number of dihybrid cross corn kernels in the following four categories: purple and smooth, purple and wrinkled, yellow and smooth, and yellow and wrinkled. In this cross, our corn had an approximate 9:3:3:1 ratio, making it a perfect selection for a Chi Square analysis. In our monohybrid cross, I classified corn kernels as yellow smooth or yellow wrinkled, finding a constant and expected 3:1 ratio. After comparing our data to the Chi Square, we found that our value of 0.400827 with a variance factor of three gave a 90-95% chance that the slight differences were due to random chance.
Indian Corn has thrived in the Americas since before the arrival of Europeans to the new world. In fact, Native Americans taught settlers how to cultivate Indian Corn. Once this corn was brought to the old world, sweet corn became the corn of choice, but Indian corn was still grown as an ornamental crop. Today, corn serves many purposes: in the culinary arts, in livestock feed, and in the production of paper, fuel, and even alcohol.
In our lab, we used a particular variety of Indian corn as it has many visible phenotypes, namely purple vs. yellow and wrinkled vs. smooth. Furthermore, Indian corn provides a large sample size to determine the expected ratio. I hypothesized that in the monohybrid corn, a 3:1 ratio of smooth to wrinkled kernels would be apparent, and in the dihybrid cross a 9:3:3:1 ratio would be apparent.
This pattern of inheritance of phenotypes and genotypes was established by monk Gregor Mendel, whose work with pea plants allowed him to discover Mendelian Genetics. The concept that genes do not blend, but instead are dominant and recessive, is widely accepted today and applies to the Indian Corn kernels in our lab.
In order to determine expected ratios of crosses, I used a Punnett Square. A Punnett Square is a chart used by geneticists to predict the outcome of certain genotypes and phenotypes in genetic crosses. In the case of our lab, for the monohybrid cross, our Punnett Square is depicted in figure 1.
Figure 1

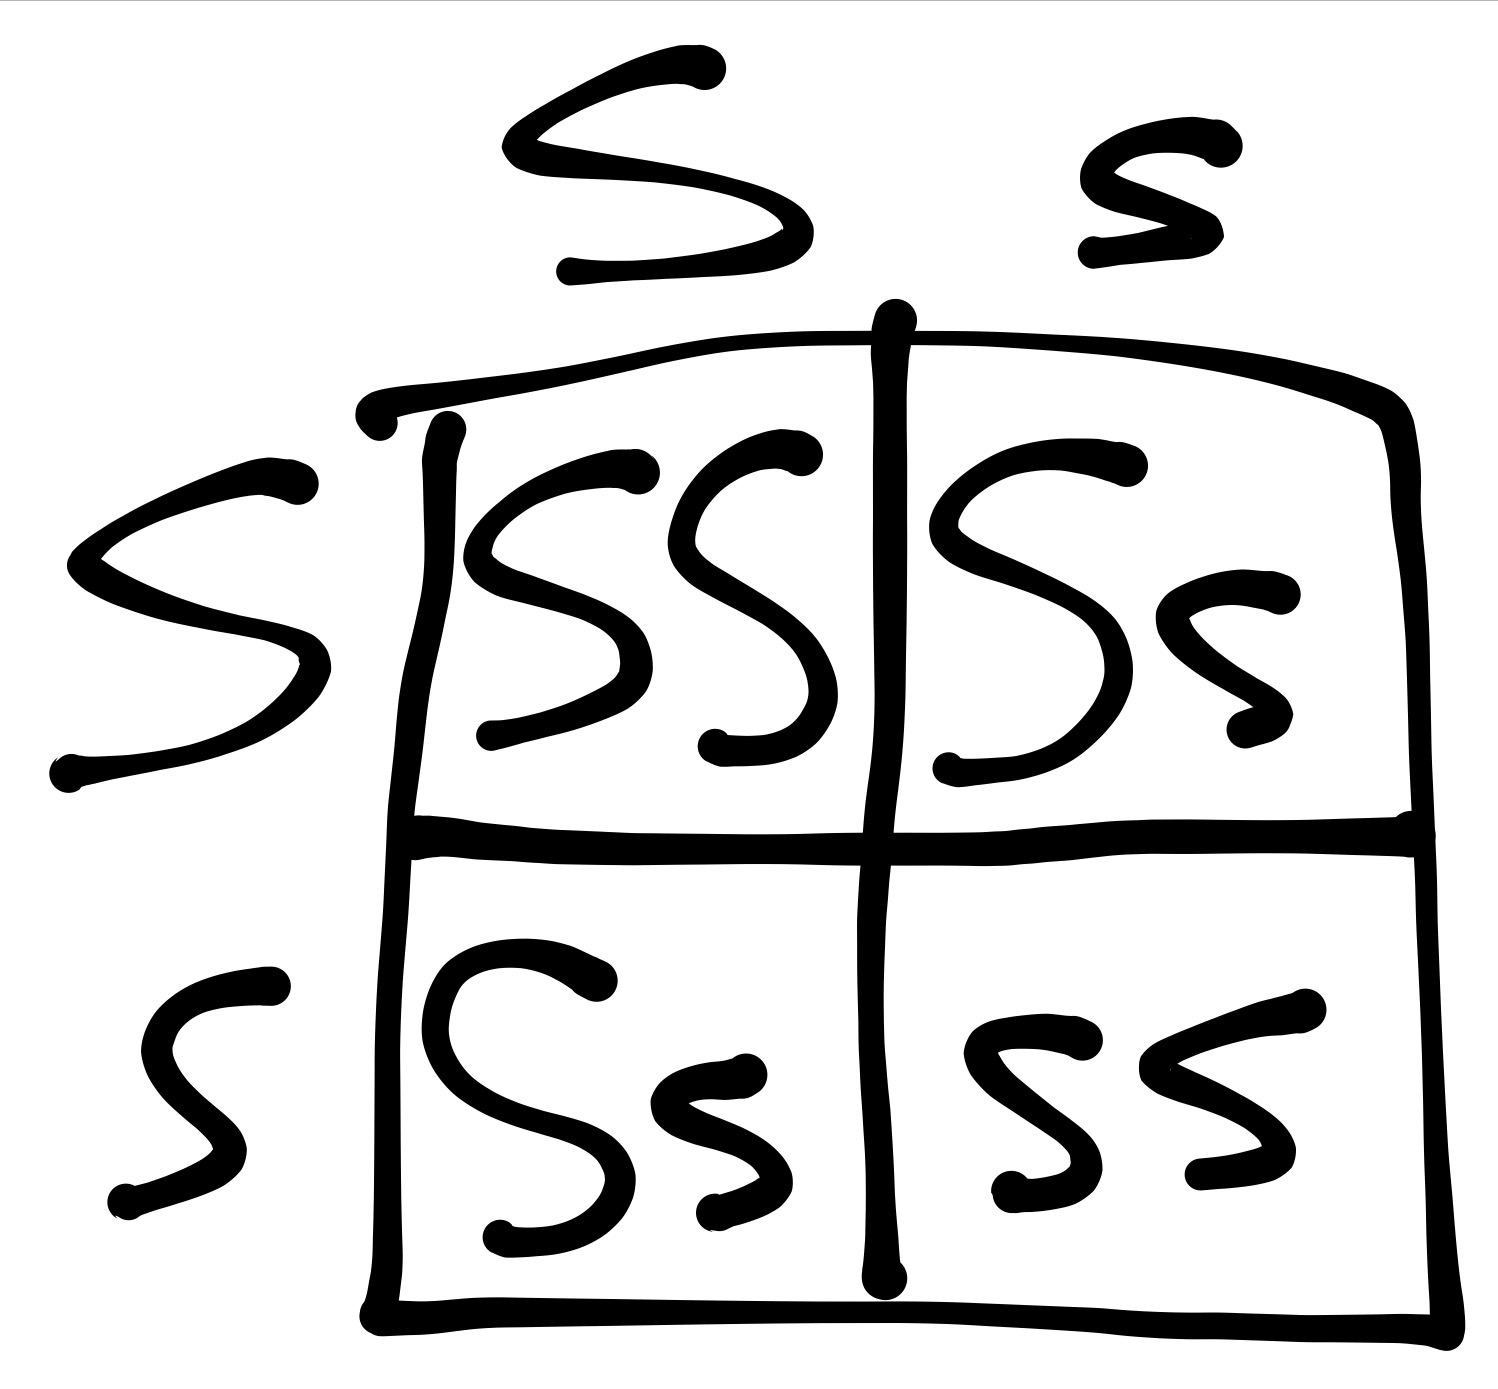
As seen in Figure 1, this Punnett Square depicts the monohybrid cross between our two heterozygous yellow smooth corn ears, using S to represent the dominant smooth phenotype and s to represent the recessive wrinkled phenotype. Thus, the Punnett square and our hypothesis predicts a 3:1 ratio of smooth kernels to wrinkled kernels.
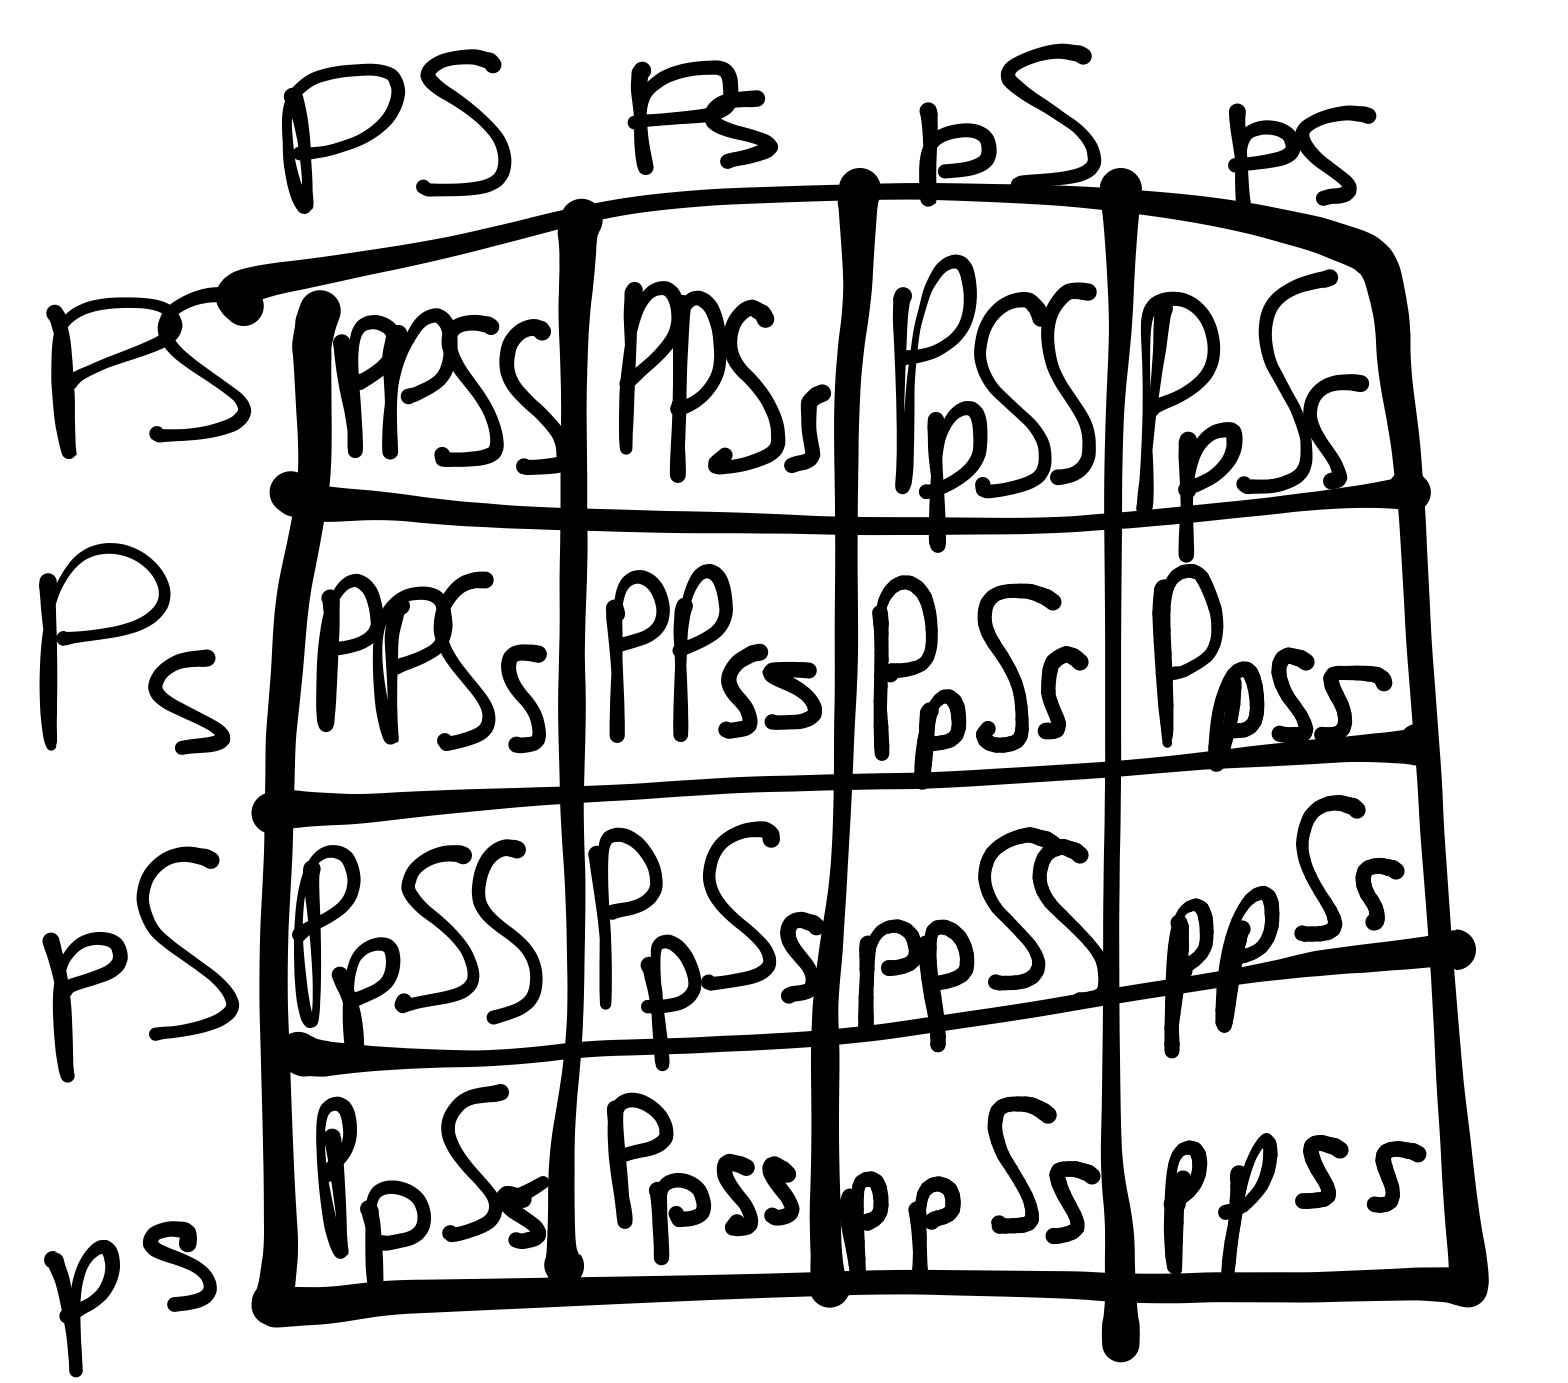
In case of our lab’s dihybrid cross, I used the Punnett Square depicted in Figure 2.
Figure 2:
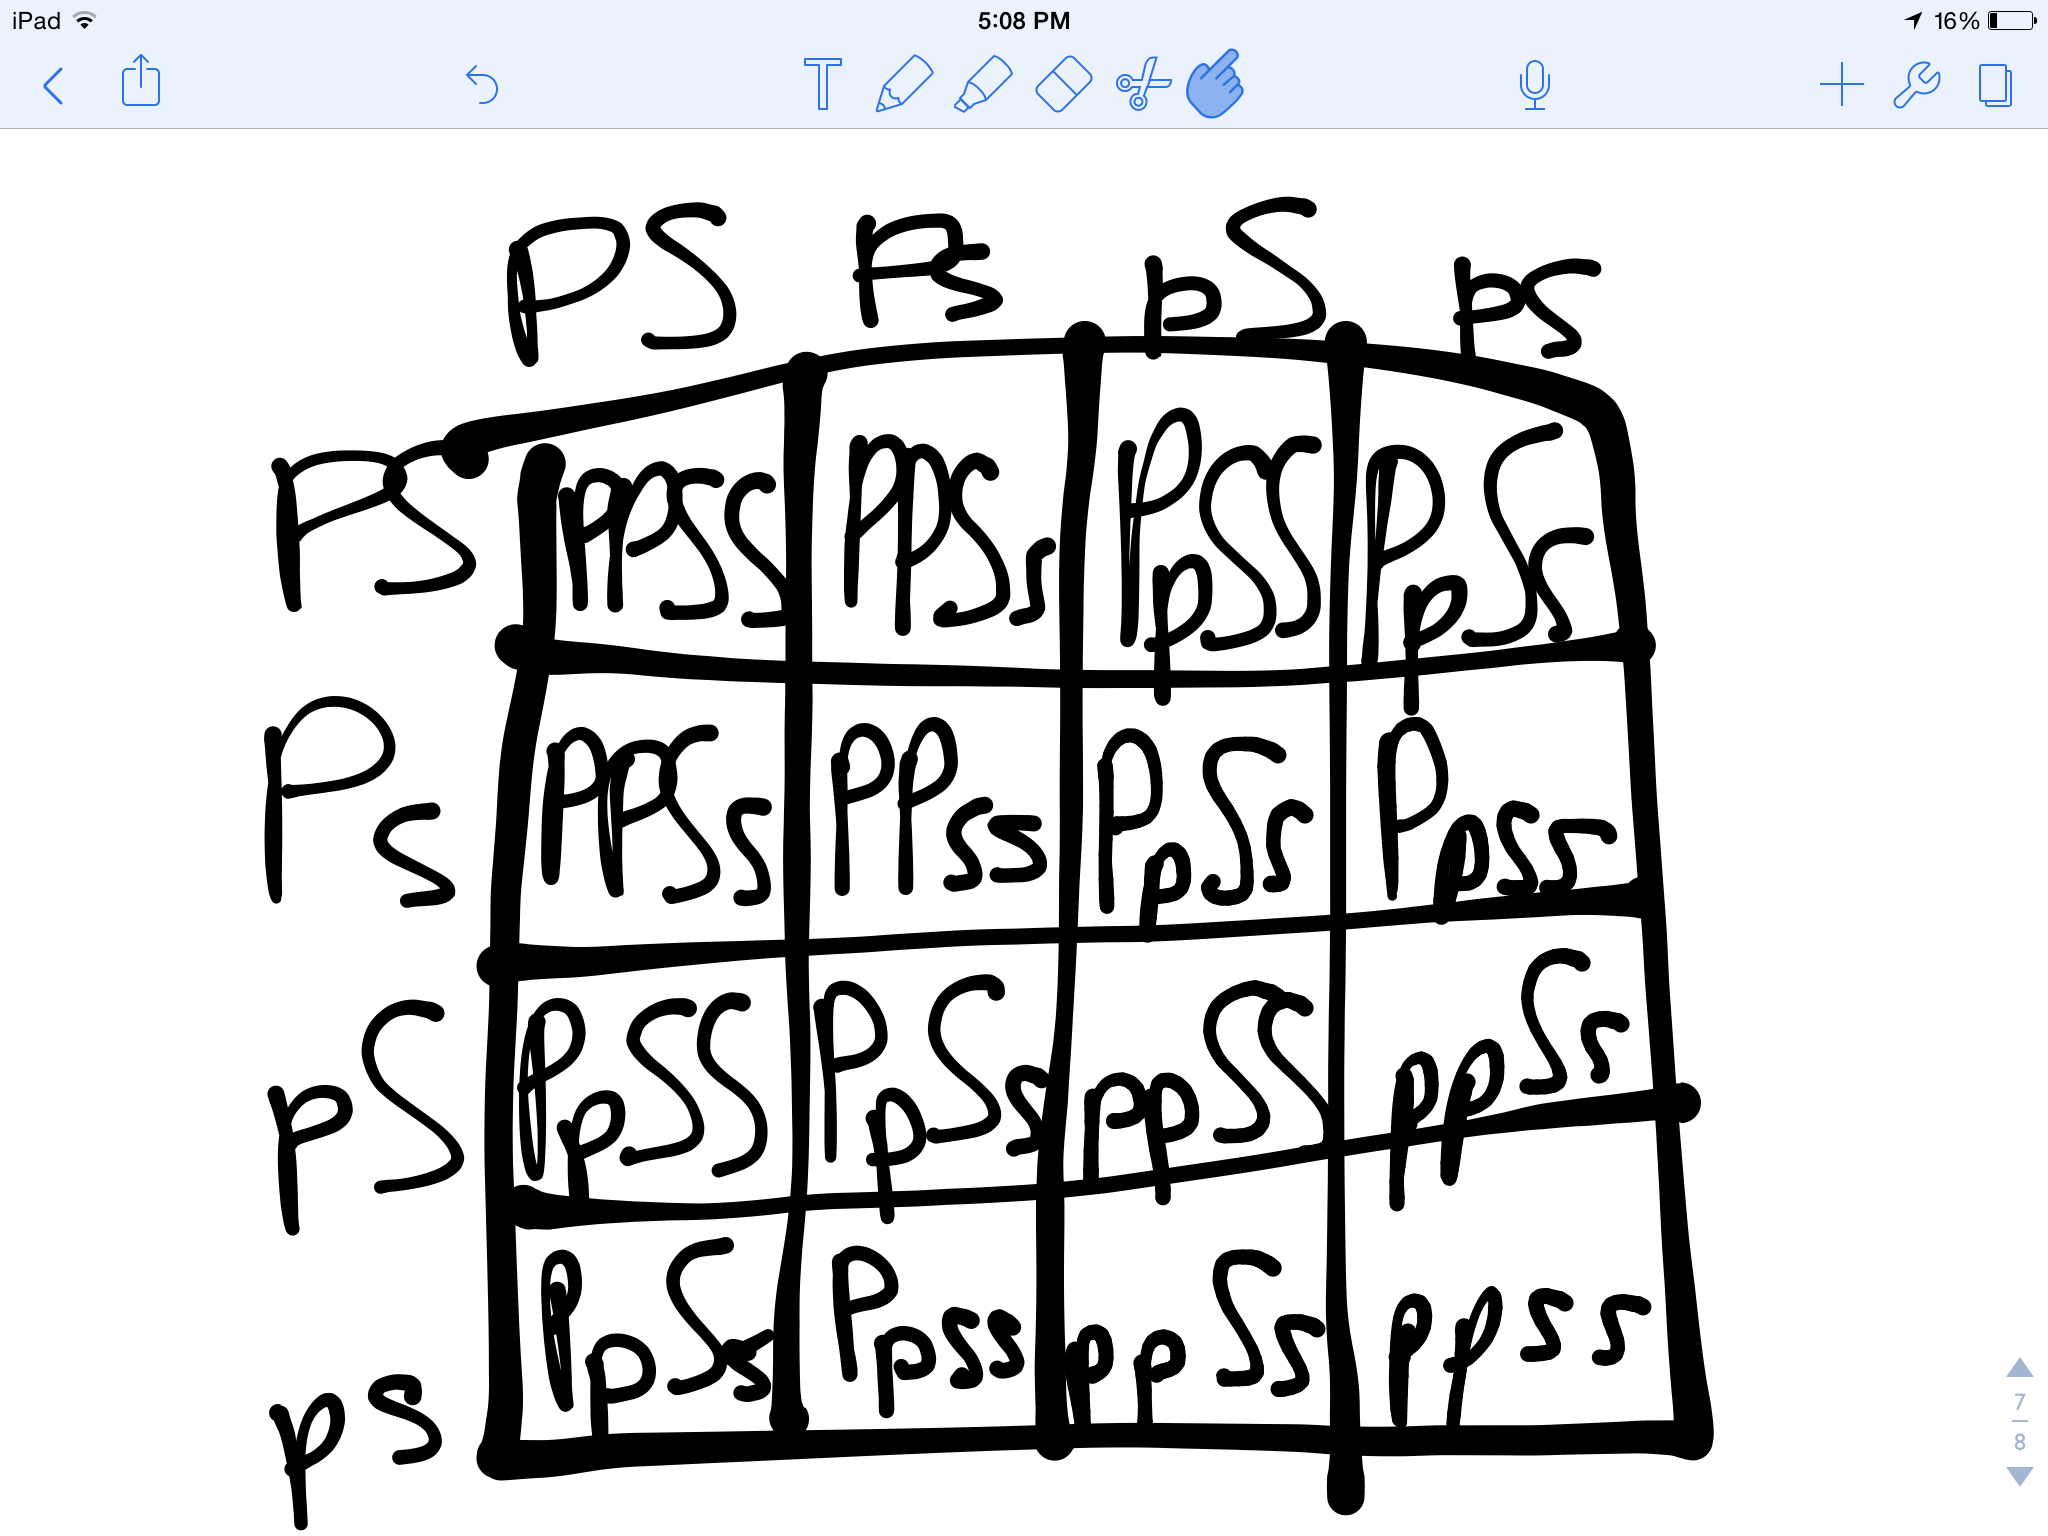
As seen in Figure 2, this Punnett Square depicts the dihybrid cross between our two heterozygous corn ears, again using S to represent the dominant smooth phenotype and s to represent the recessive wrinkled phenotype. I also used P to represent the dominant purple phenotype, and p to represent the recessive yellow phenotype. Thus, the Punnett square predicts a 9:3:3:1 ratio of purple smooth kernels purple wrinkled kernels to yellow smooth kernels to yellow wrinkled kernels, which is also our hypothesis.
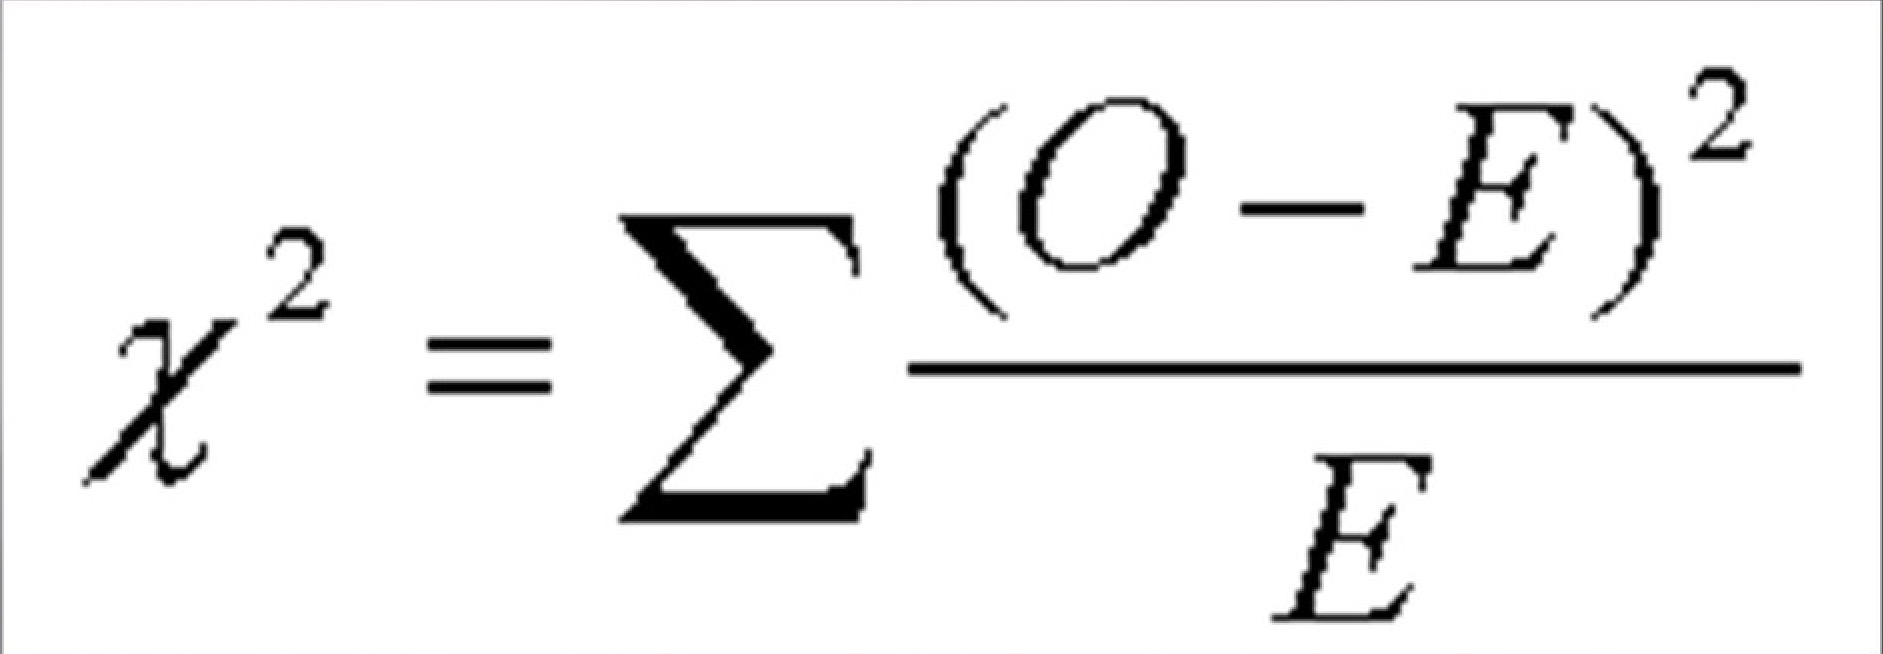
To determine if my hypothesis is valid, I used a Chi Square. A Chi Square is a test that compares observed data with the expected data from a hypothesis. A null hypothesis is when there is no difference between the observed and expected data. The Chi Square determines the probability of deviations from the expected data being due to random chance. To use the Chi Square Chart, one must determine the Chi Square Value, which is found via the equation in Figure 3.
Figure 3:

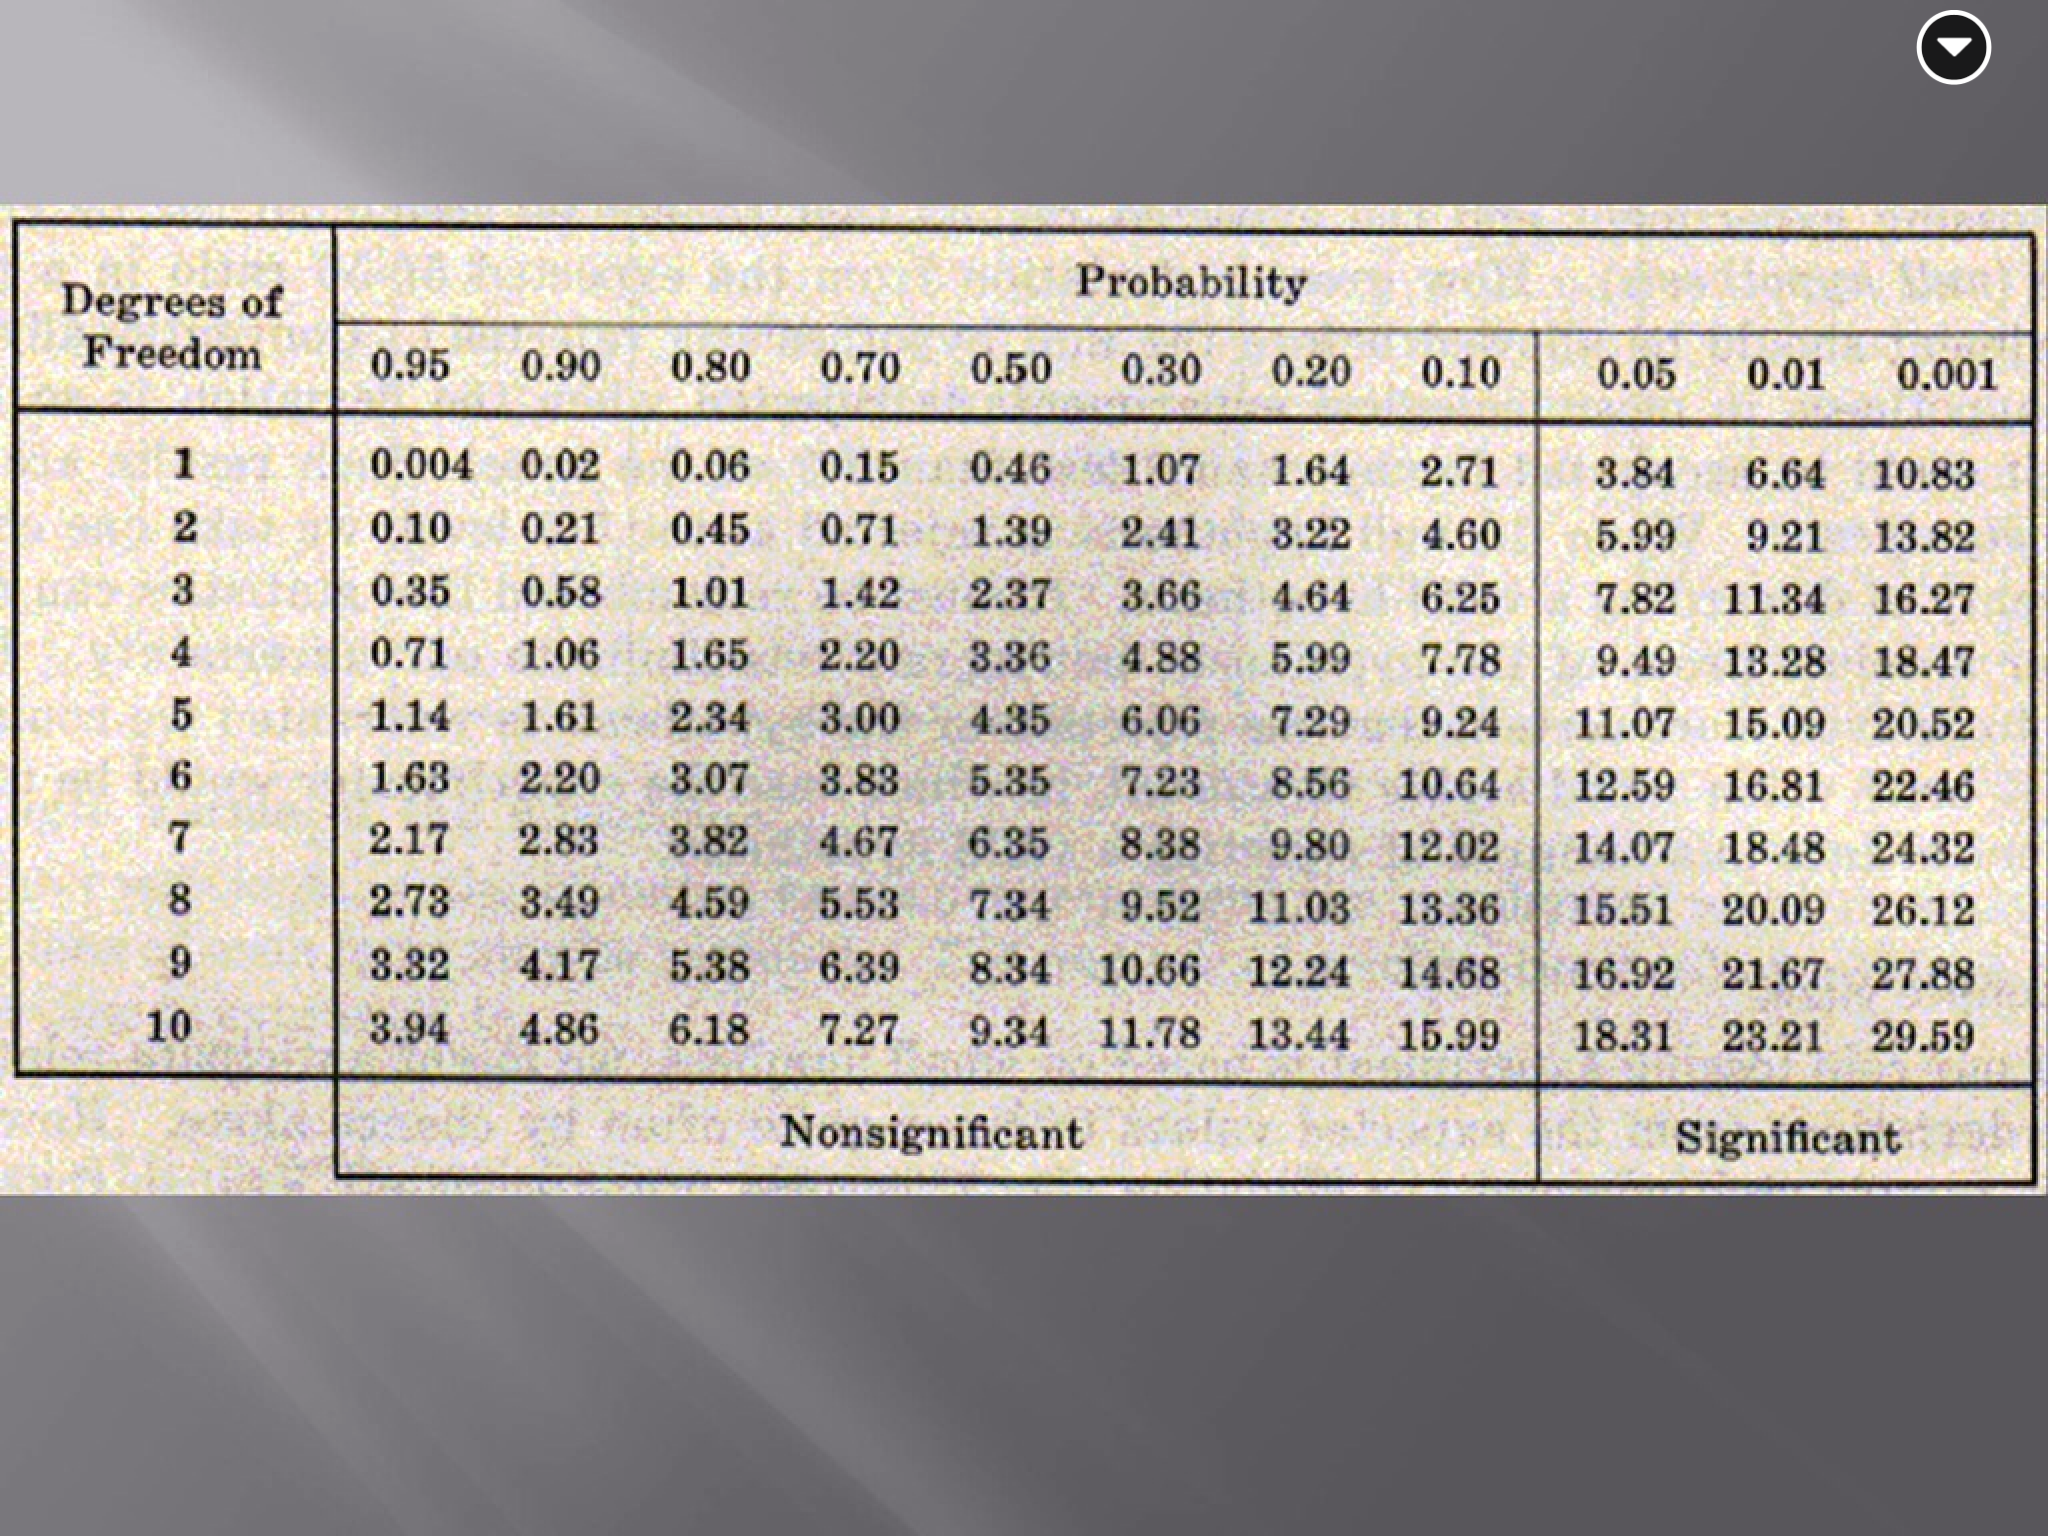
While determining the Chi Square value, one finds the degrees of freedom, or the number of classes observed minus one. Then the value and degree of freedom are plotted on the Chi Square graph, which corresponds to a percentile that represents the probability that deviations were caused by random chance. A Chi square is depicted below in Figures 4.1 and 4.2
Figures 4.1 and 4.2:
Materials:
-Indian Corn, one with a Monohybrid Cross (Smooth vs. Wrinkled), one with a Dihybrid Cross (Smooth vs. Wrinkled and Yellow vs. Purple)
-Calculator
-Chi Square Table
-Paper or Note Taking App
Procedure:
Monohybrid Cross:
1.) I counted the number of smooth kernels and wrinkled kernels in five rows of corn kernels and noted the total numbers.
2.) I found the expected value of the smooth and wrinkled kernels using the total number of kernels and using the 3:1 expected ratio.
3.) I found the Chi square number by the Chi Square Equation described above, and compared it with the Chi Square with a variance of one.
Dihybrid Cross:
1.) I counted the number of purple smooth, purple wrinkled, yellow smooth and yellow wrinkled kernels in five rows of corn kernels and noted the total numbers.
2.) I found the percentages of each phenotype of corn out of the total number of kernels.
3.) I calculated the expected value of the kernels using the total number of kernels and using the 9:3:3:1 expected ratio.
4.) I again found the Chi square number by the Chi Square Equation described above, then added the values together.
5.) I compared the Chi Square Number with the Chi Square with a variance of three.
Figure 5:
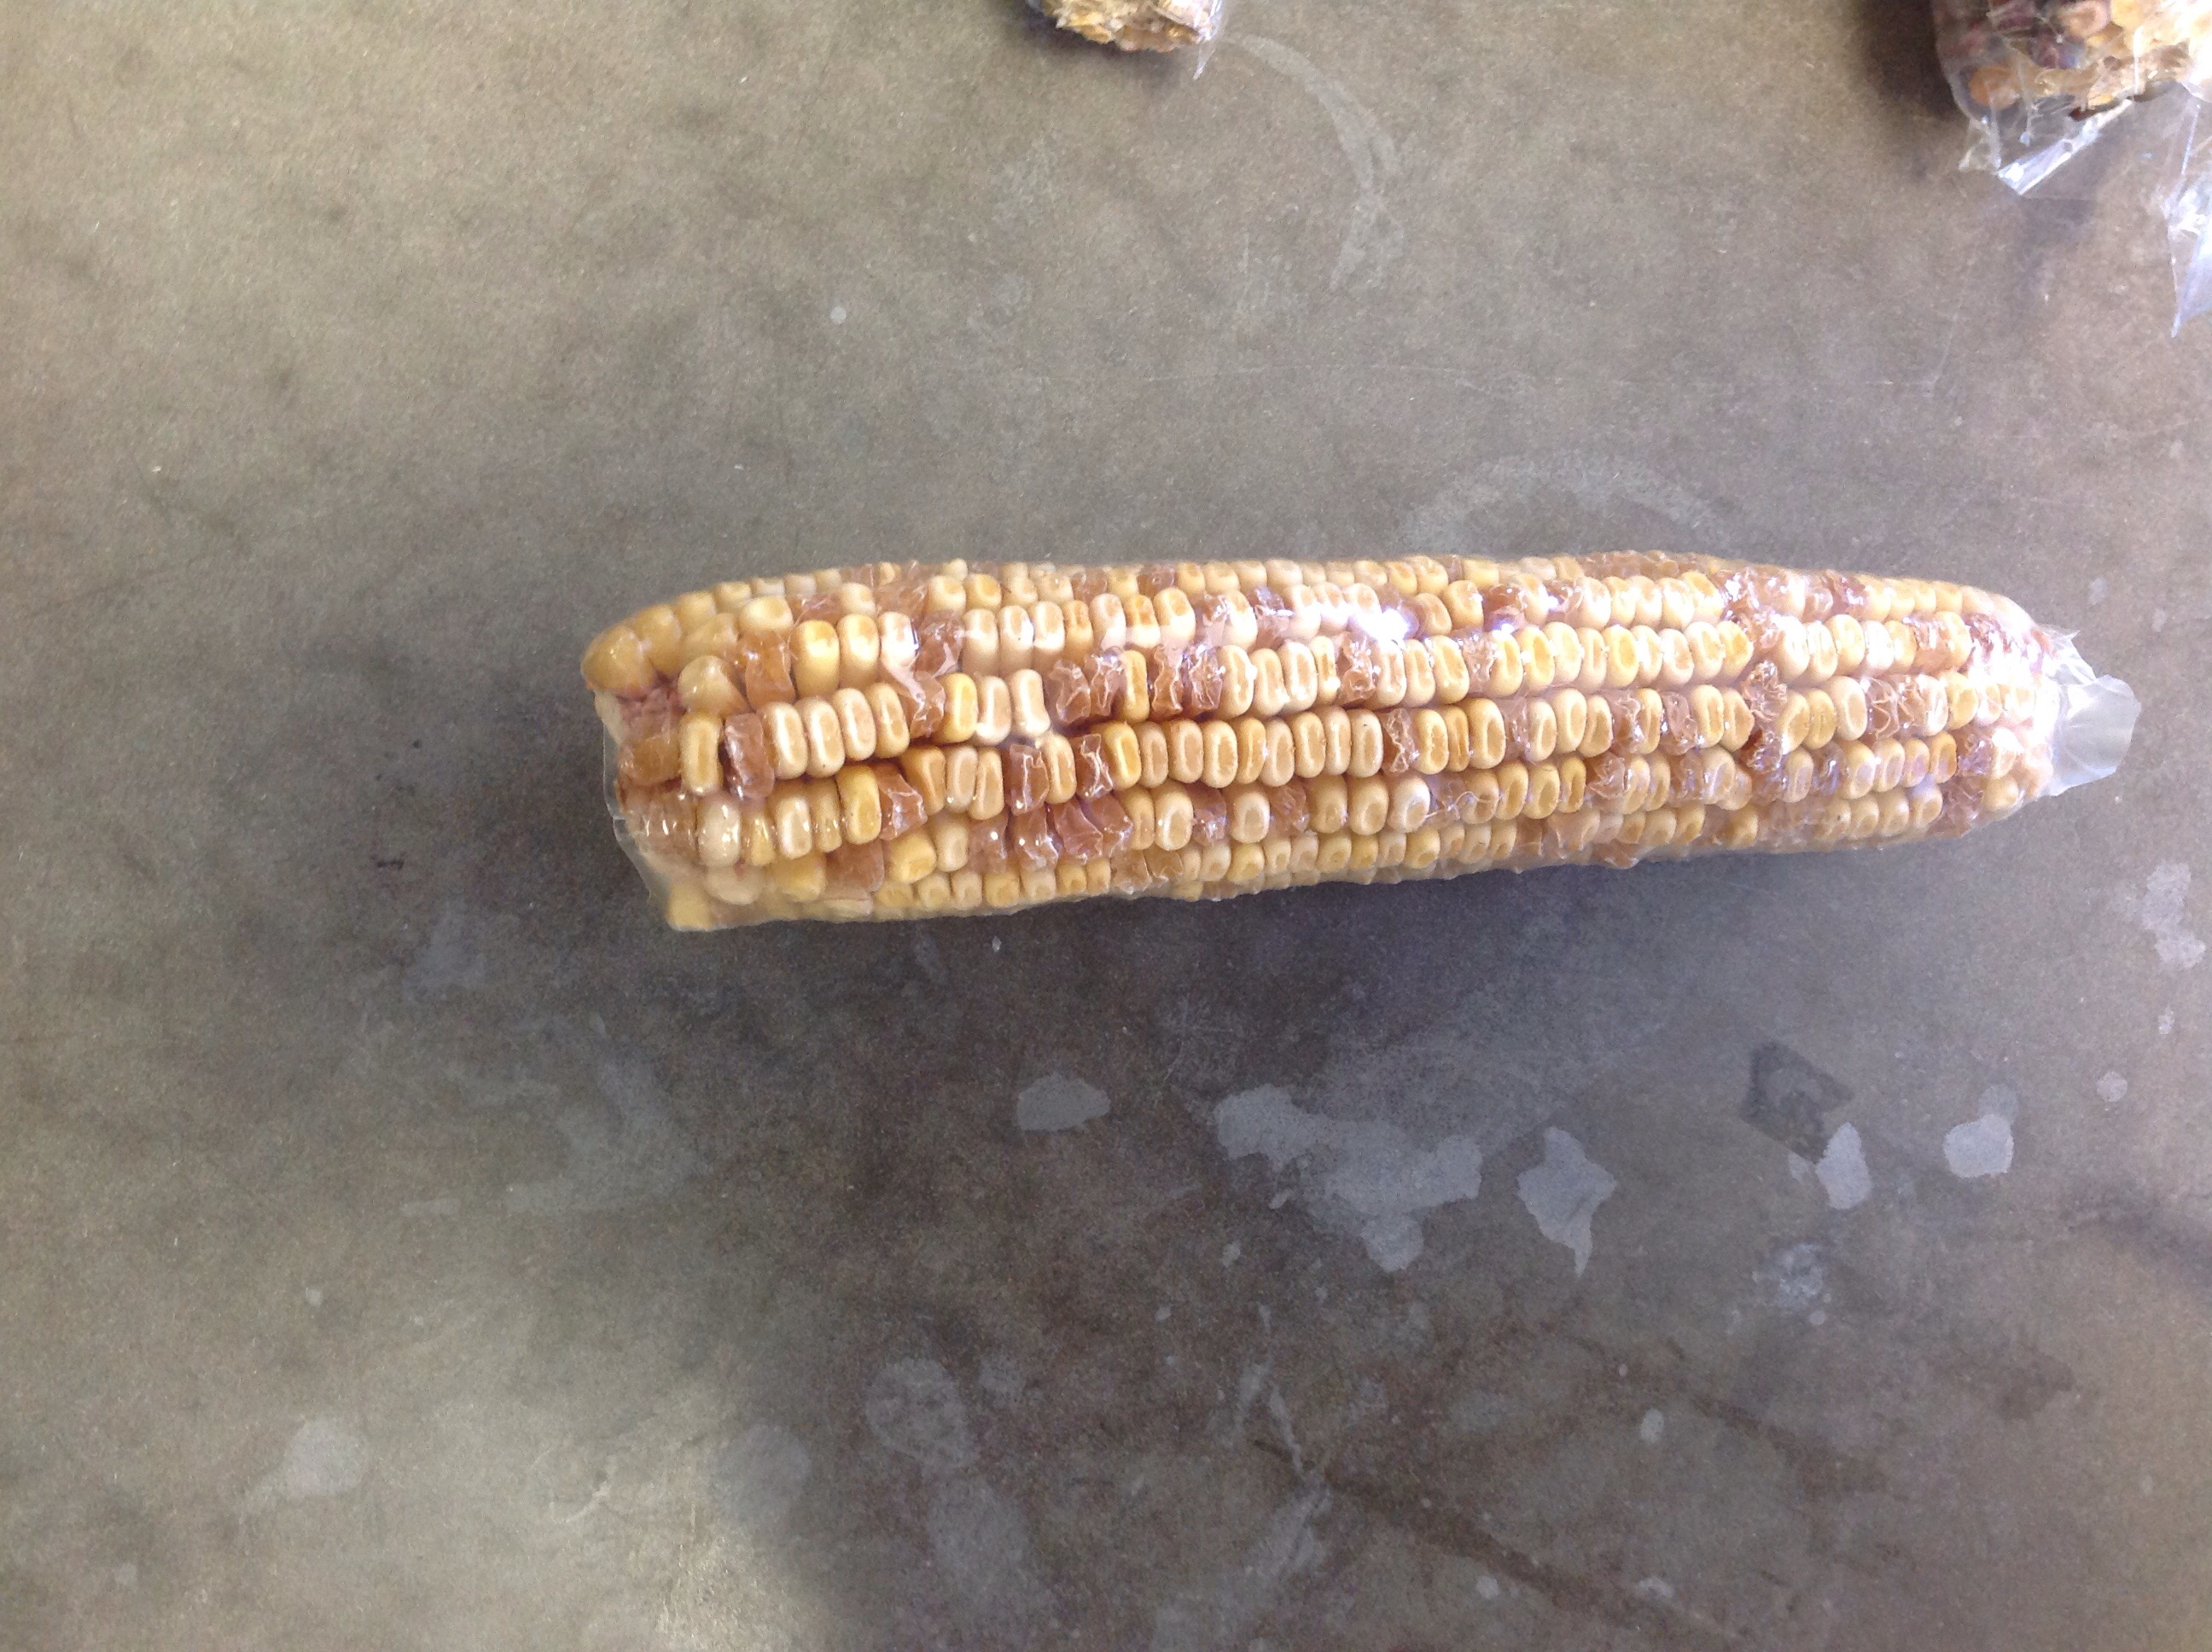
As depicted in Figure 5, a monohybrid cross Indian Corn contains both yellow smooth and yellow wrinkled kernels. I calculated that this particular cob had a total of 215 kernels in our five row test area, 166 of them yellow smooth, accounting for 77.8 percent, and 49 of them yellow wrinkled, accounting for 22.2 percent of the total kernels.
Figures 6 and 7:
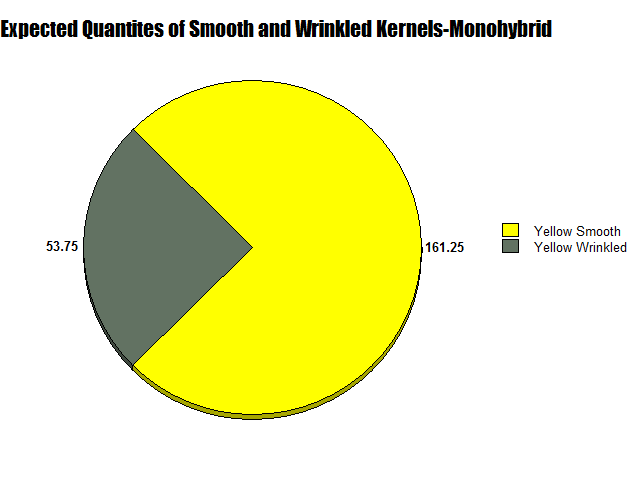
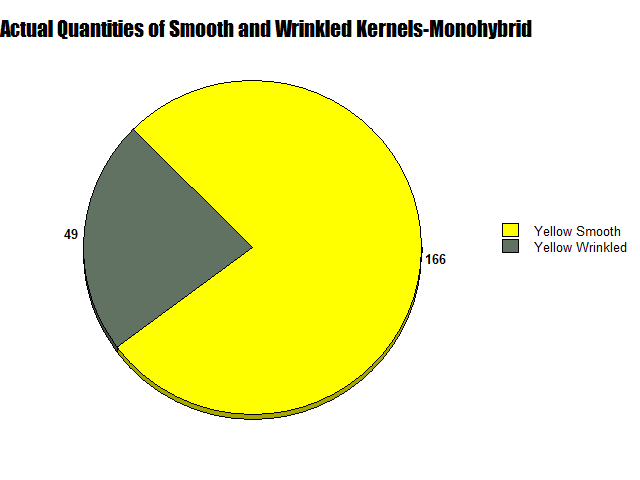
As seen in Figures 6 and 7, two circle graphs represent the expected quantities of yellow smooth and wrinkled kernels based on our Punnett Square Analysis and the results from our lab. Although my Punnett Square predicted that 161.25 kernels would be yellow smooth and 53,75 would be yellow wrinkled, actually 166 yellow smooth and 49 yellow wrinkled were observed.
Figure 8:
As depicted in Figure 8, a monohybrid cross of purple smooth and yellow smooth is present. In five row of corn kernels, I observed a total of 254 kernels, more than that of the yellow smooth/wrinkled variety. In this ear of corn, 206 kernels were purple smooth and 49 kernels were yellow smooth. The purple kernels accounted for 81.7 percent of the total kernels, while yellow kernels only accounted for 19.3 percent.
Figures 9 and 10:
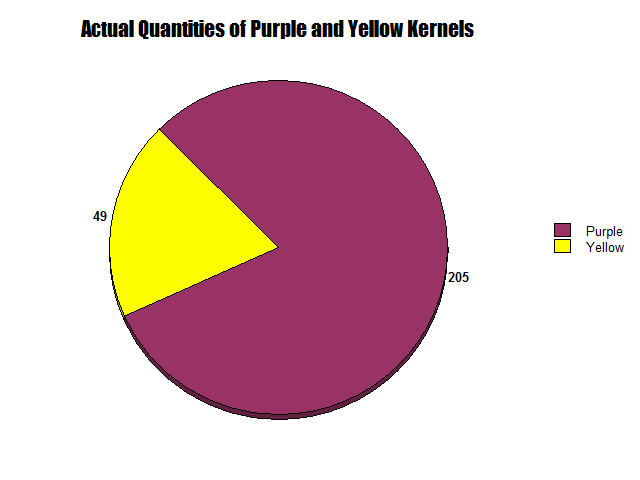
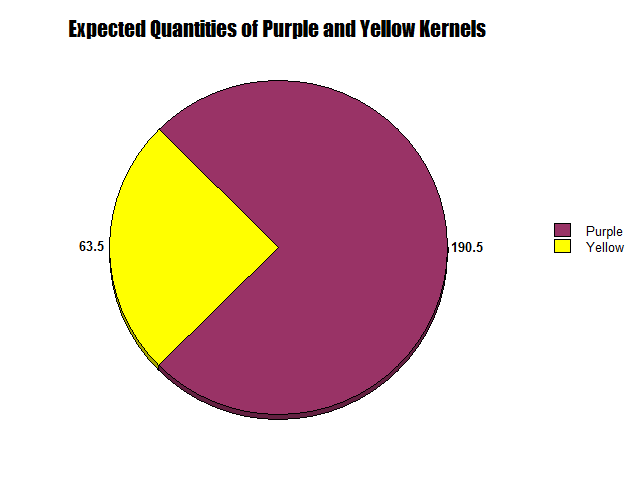
As seen in Figures 9 and 10, two circle graphs represent the expected quantities of purple smooth and yellow smooth kernels based on our Punnett Square Analysis and the results from our lab. Although my Punnett Square predicted that 190.5 kernels would be purple and 63.5 would be yellow, actually 205 purple smooth and 49 yellow smooth were observed.
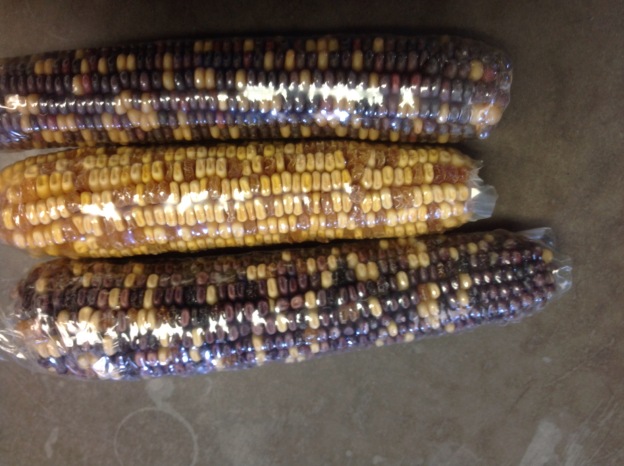
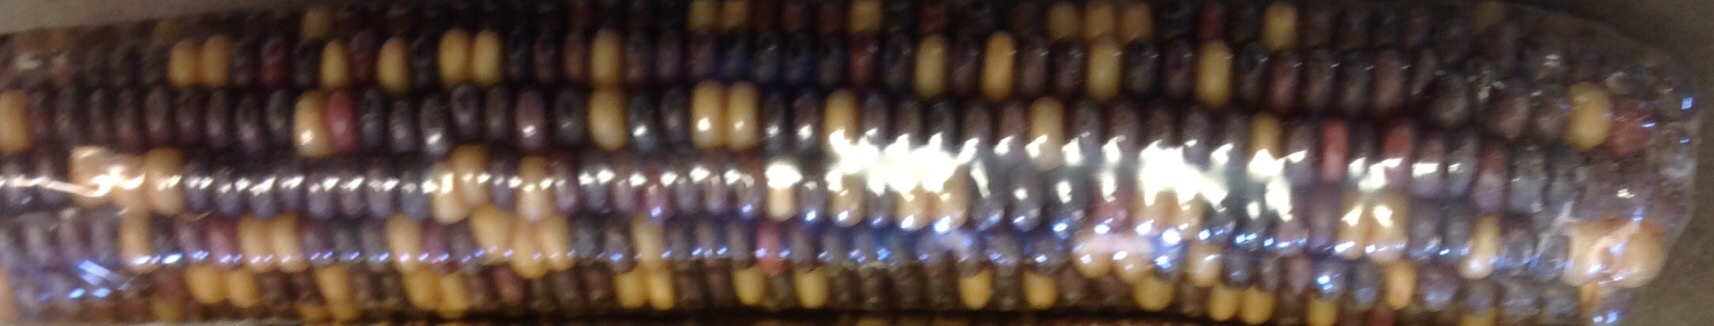
Figure 11:
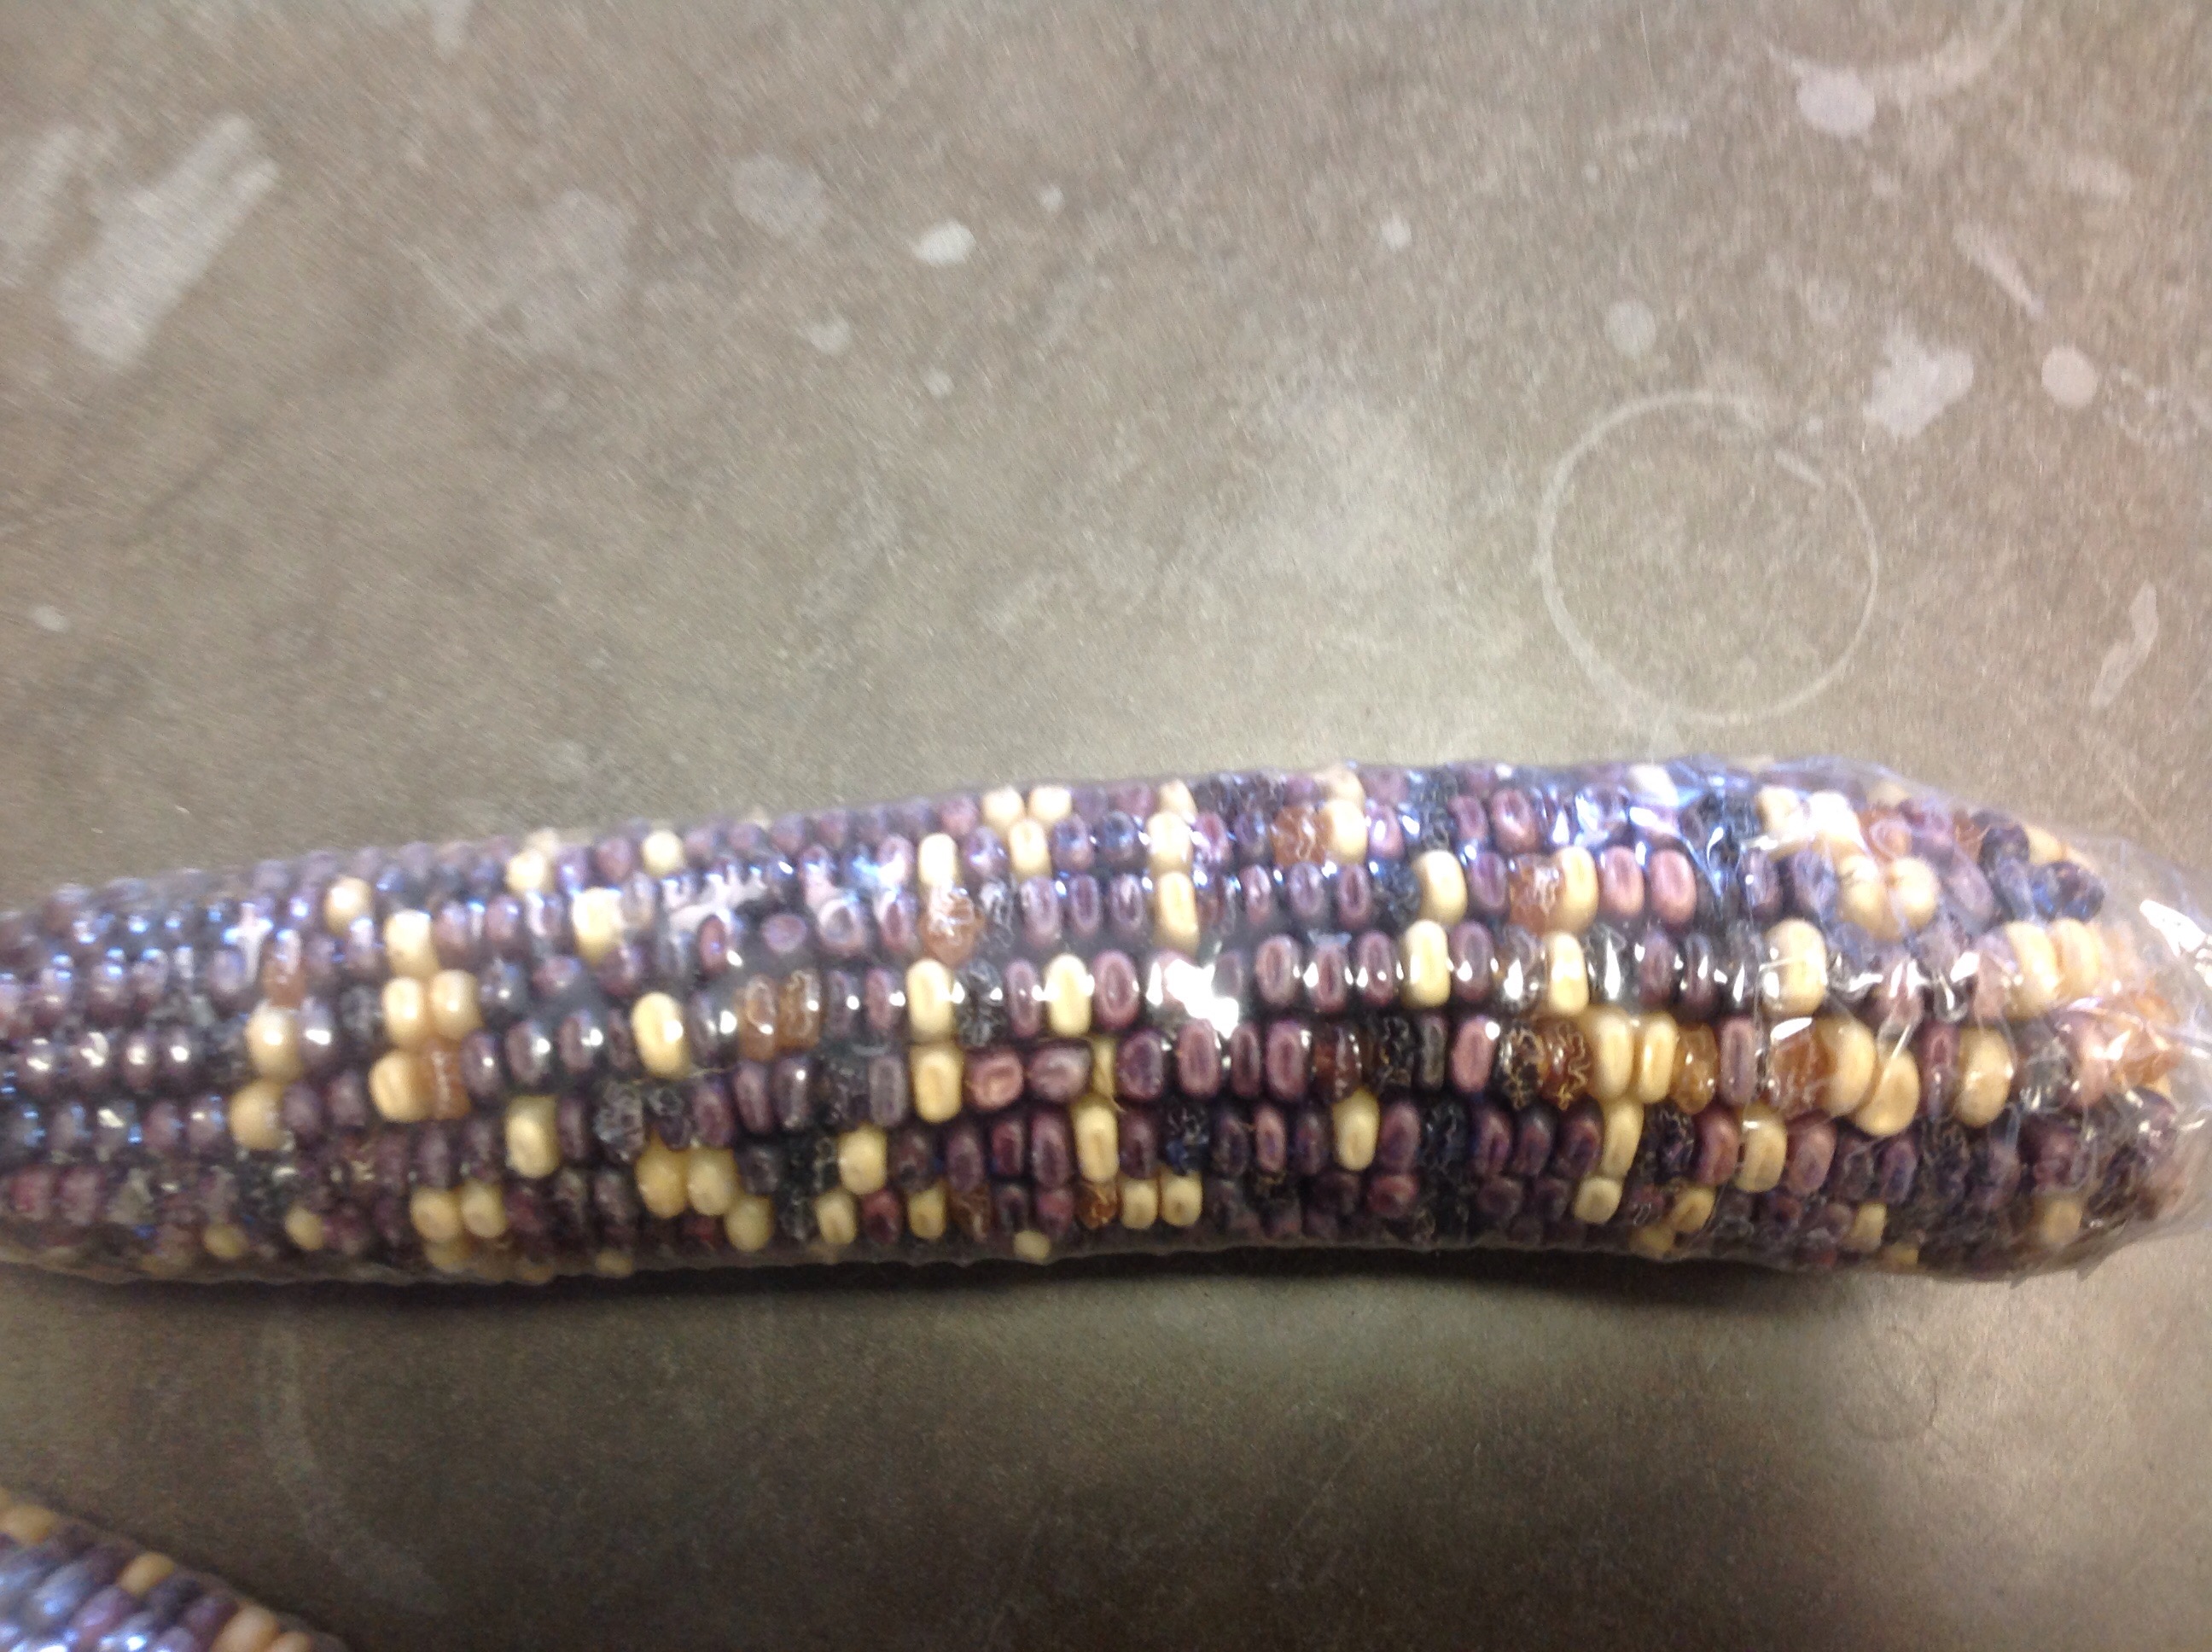
As seen in Figure 11, this corn cob represents a dihybrid cross, with both smooth and wrinkled, yellow and purple kernels. The Punnett Square predicts a 9:3:3:1 Ratio of Purple Smooth to Purple Wrinkled to Yellow Smooth to Yellow Wrinkled. In five rows of this cob, I totaled 244 kernels, 137 purple smooth, 47 purple wrinkled, 43 yellow smooth, and 17 yellow wrinkled. This approximately yields 56.55 percent purple smooth, 19.22 purple wrinkled, 17.22 yellow smooth, and 6.97 percent yellow wrinkled.
Figures 12 and 13
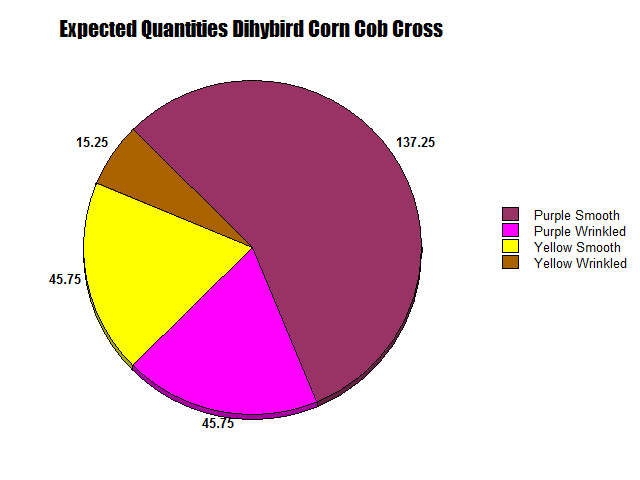
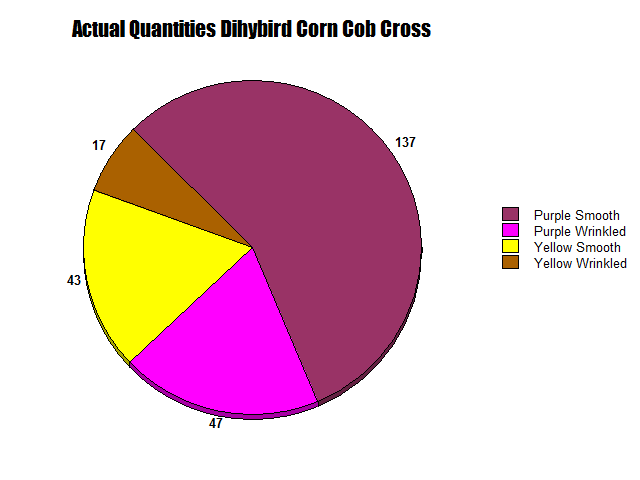
As seen in Figures 12 and 13, two circle graphs represent the expected quantities of purple smooth, purple wrinkled, yellow smooth, and yellow wrinkled kernels based on our Punnett Square Analysis and the results from our lab. Although my Punnett Square predicted that 137.25 kernels would be purple smooth, 45.75 would be purple wrinkled and yellow smooth and 15.25 would be yellow wrinkled, but 137 purple smooth, 47 purple wrinkled, 43 yellow smooth and 17 yellow wrinkled were observed.
Figure 14:
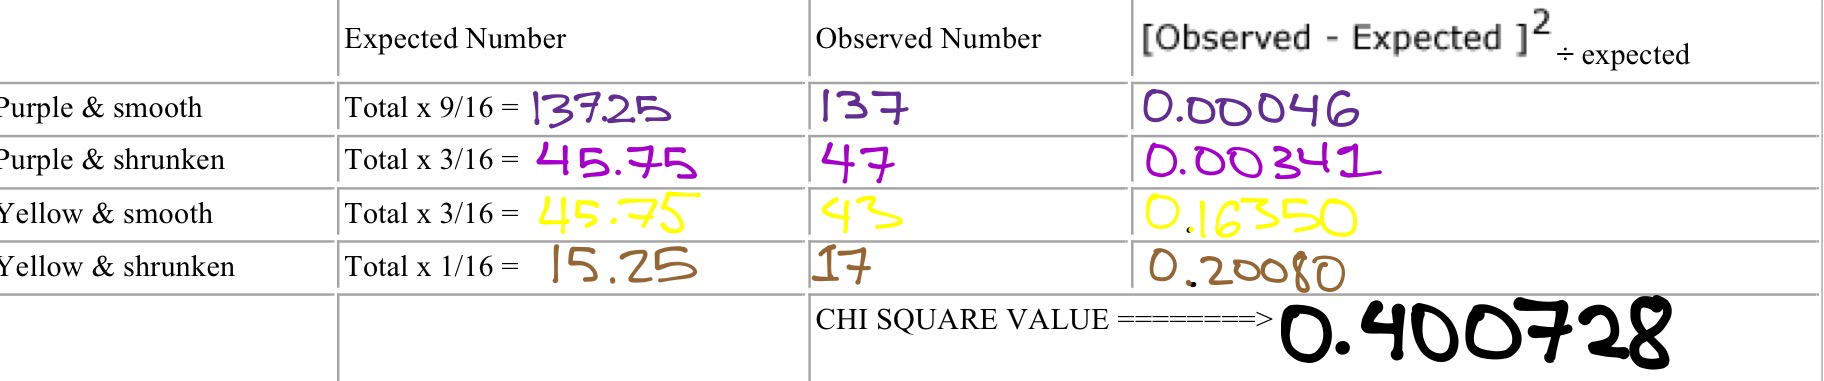
As seen in Figure 14, the results of our Chi Square analysis is shown, we had a combined total Chi Square Number of 0.400728, with a variance factor of 3.
Figure 15:

As seen in Figure 15, I plotted the Chi Square Number on a Simplified Chi Square. My number of .400728 yields that there was a greater than 90% chance our minor discrepancies were due to random chance, making our dihybrid corn cob a good test subject.
Figures 16 and 17:
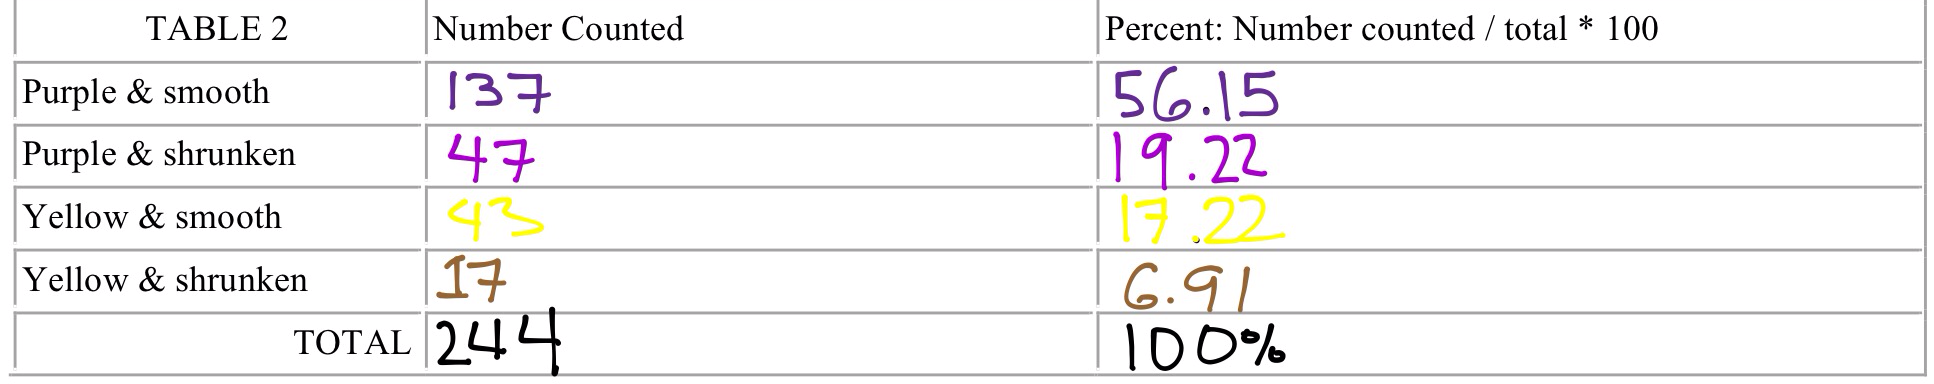
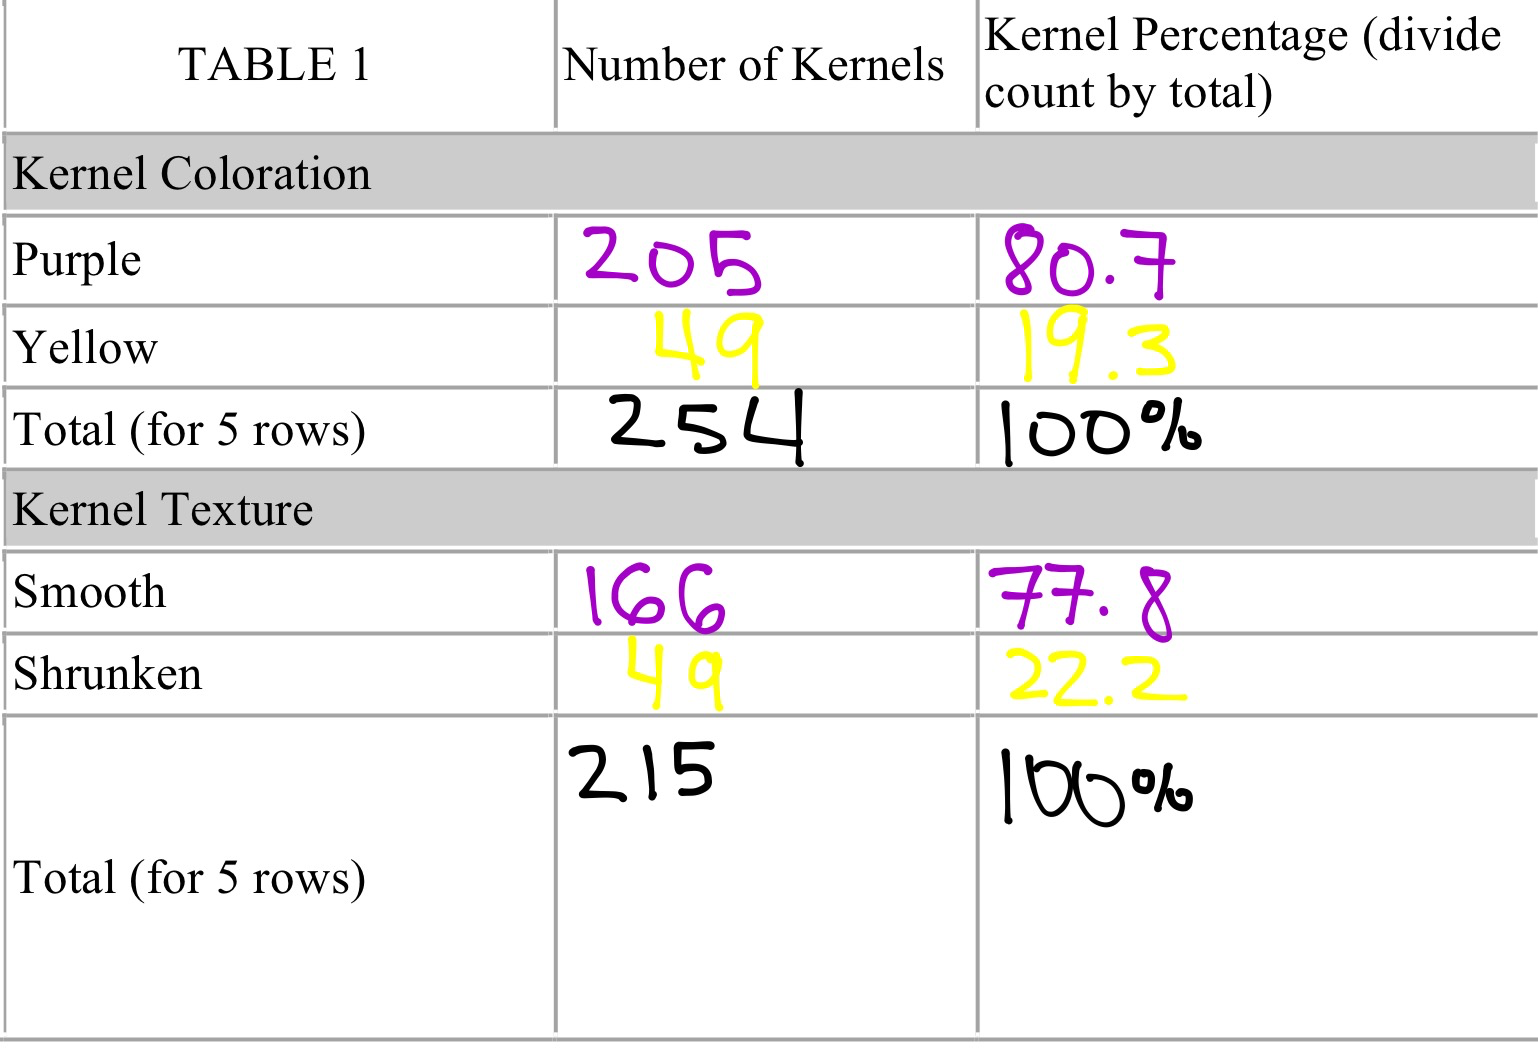
As seen in Figures 16 and 17, additional tables represent the total number of kernels observed in both the monohybrid and dihybrid crosses, with the respective percentages for each corn phenotype.
Discussion Questions:
Monohybrid Cross:
1. Which phenotypes appear to be dominant?
*In the yellow wrinkled/yellow smooth corn cob, the smooth phenotype, appears to be dominant, while in the yellow/purple corn cob, the purple appears to be dominant.
2. What are the probable genotypes of the parents with regard to coloration? (Use P)
*In the yellow smooth, yellow wrinkled corn cob, the genotypes of its parents where pp and pp, while in the yellow/purple corn cob, it exhibited characteristics of Pp and Pp.
3. What are the probable genotypes of the parents with regard to texture? (Use S)
*In the yellow smooth, yellow wrinkled corn cob, the genotypes of its parents where Ss and Ss, as it exhibited a 3:1 ratio of smooth to wrinkled kernels. while in the yellow/purple corn cob, it displayed characteristics of SS and SS.
4. What is the expected % of purple to yellow?
*In a cross of two heterozygous purple corn ears, and expected 3:1 ratio purple to yellow or 75% to 25% (purple to yellow)
5. Does your observed data match what is expected?
*In both of our monohybrid cross corn ears the observed data does not exactly correlate with the expected data, particularly in the purple/yellow corn cob, which is off by an expected 14.5 kernels.
Dihybrid Cross:
6.Did you obtain a 9:3:3:1 ratio?
*In our dihybrid cross corn ear, I did not obtain an exact 9:3:3:1 ratio, but it was very close. In our Chi Square Analysis, I determined that our minor discrepancies had an over 90% chance of being caused by random chance.
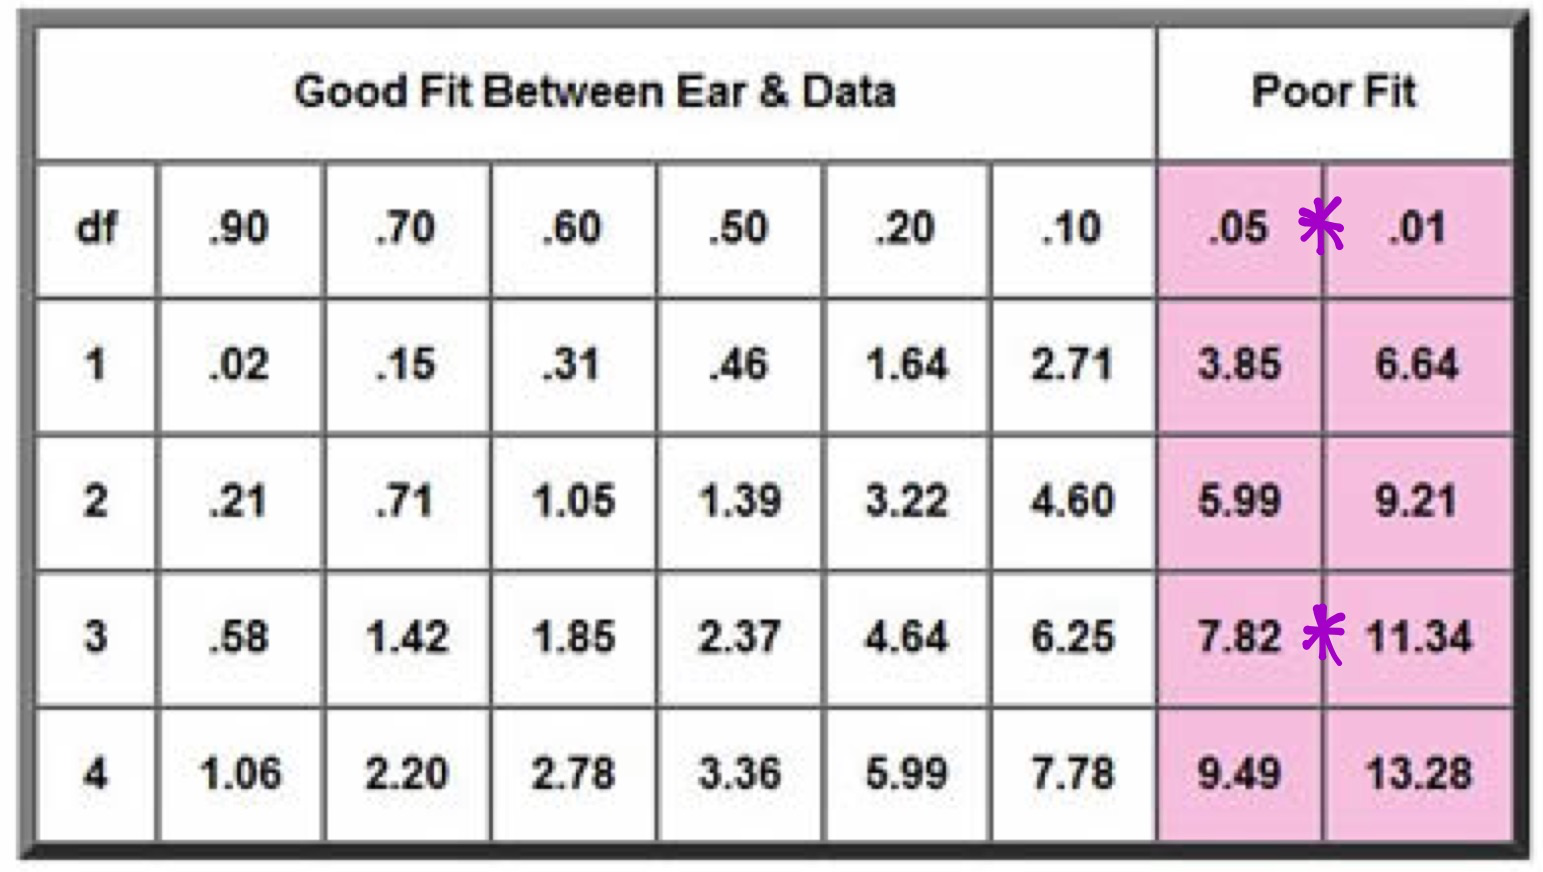
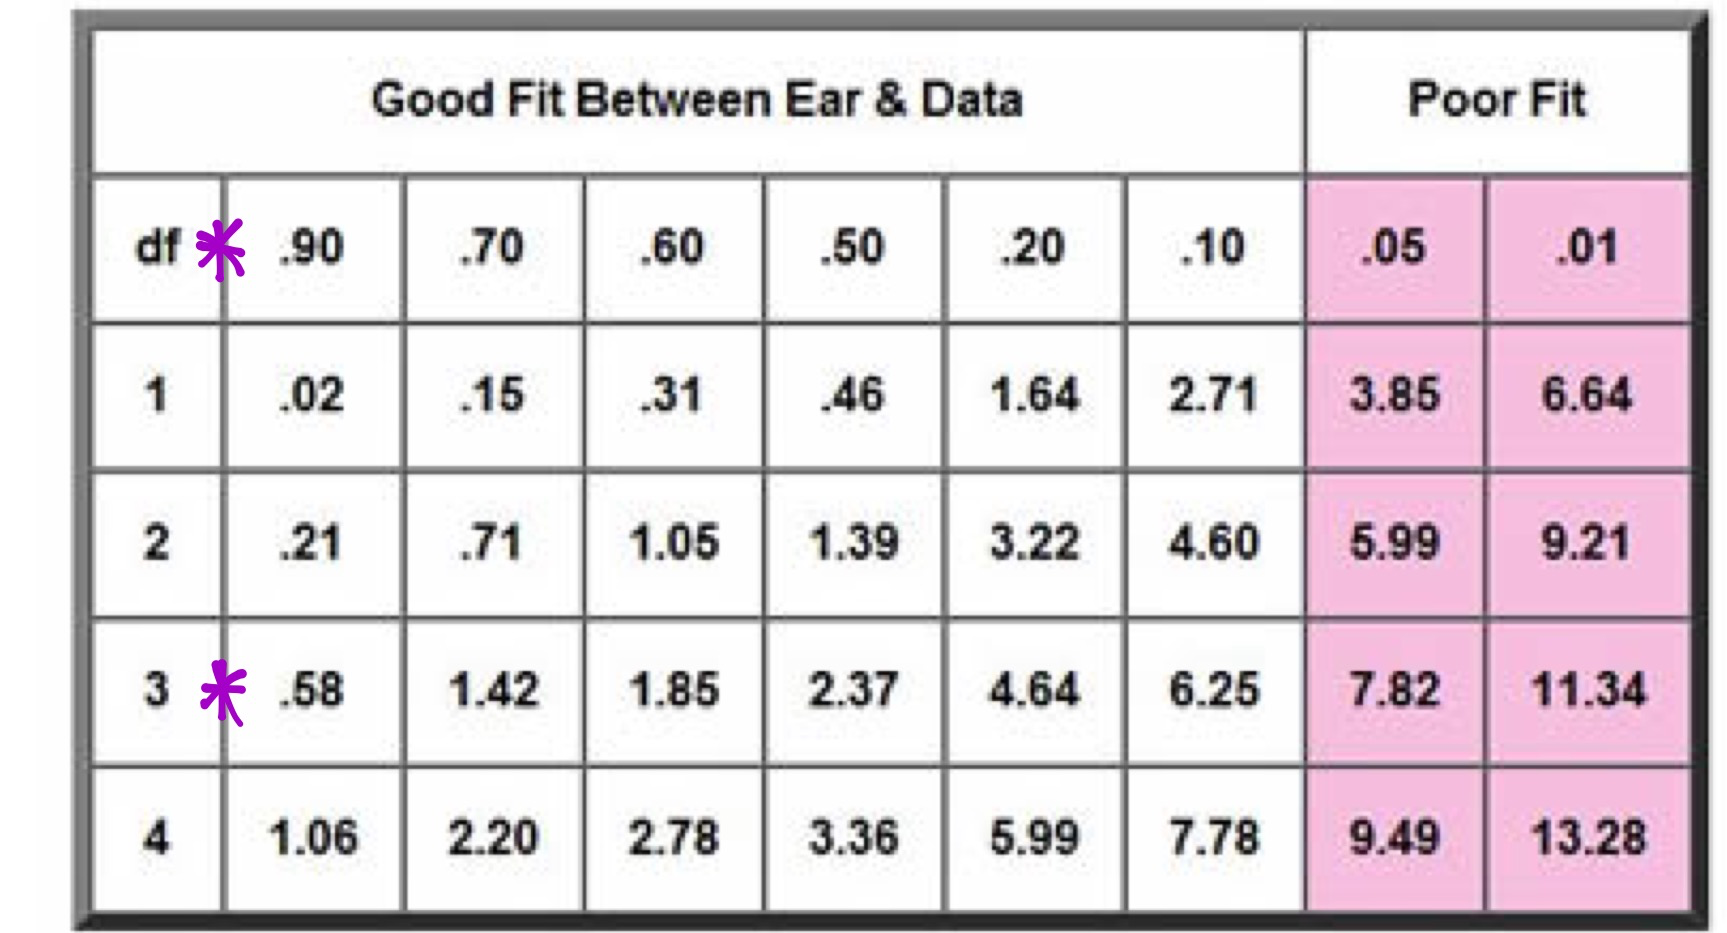
7. Explain what it means to have a “good fit” or a “poor fit”. Does your chi square analysis of real corn data support the hypothesis that the parental generation was PpSs x PpSs?
*A good fit on a Chi Square Analysis is considered to be a sample size with a greater than 5 percent probability that discrepancies in results were due to random chance, while poor fits are considered the probability of random chance at 5 percent or less. Poor fits are considered bad sample sizes and the results contradict the hypothesis. Our data, with minor discrepancies and a greater than 90% chance of them being due to random chance, is definitely a “good fit.”
8. List two reasons why data might have a poor chi square fit.
*Two reasons for a poor Chi Square Fit include a poor sample selection, in our case the corn cob, or an inaccurate hypothesis, in which the expected total is significantly different from that of the actual total.
Sample Questions:
1.
Problem: A large ear of corn has a total of 433 grains, including 271 Purple & starchy, 73 Purple & sweet, 63 Yellow & starchy, and 26 Yellow & sweet.
Your Tentative Hypothesis: This ear of corn was produced by a dihybrid cross (PpSs x PpSs) involving two pairs of heterozygous genes resulting in a theoretical (expected) ratio of 9:3:3:1.
Objective: Test your hypothesis using chi square and probability values.
To find the expected total number of kernels of a dihybrid cross, I used the following Punnett Square, where P is the dominant purple and S the dominant starchy:
Figure 18:
 e
e
By finding the 9:3:3:1 ratio, I can calculate the expected quantities for each:
Purple Smooth: 9/16 x 433 = 243.5625
Purple Wrinkled: 3/16 x 433 = 81.1825
Yellow Smooth: 3/16 x 433 = 81.1825
Yellow Wrinkled: 1/16 x 43 = 27.0625
Next, using the equation displayed in Figure 19, I can determine the individual Chi Square Values for each phenotype,
Figure 19
This results in the following equation:
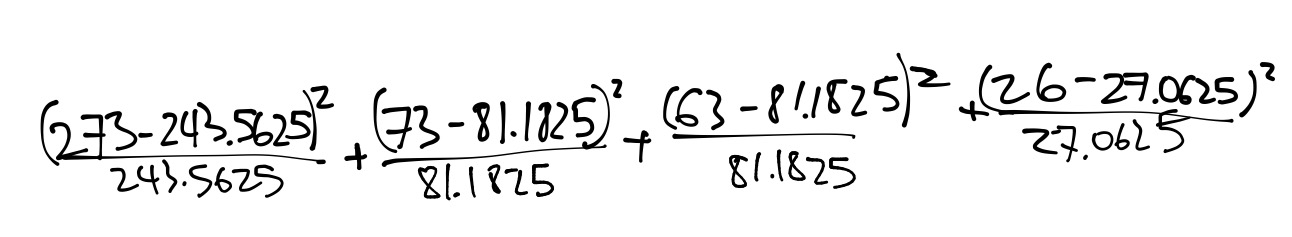
3.5579+0.8247+4.0723+0.0417=8.4965
With a variance of three, it yield a value between 1 and 5 percent making this a poor fit.
Figure 20:
2.
Problem: In a certain reptile, eyes can be either black or yellow. Two black eyed lizards are crossed, and the result is 72 black eyed lizards, and 28 yellow-eyed lizards.Your Tentative Hypothesis: The black eyed parents were Bb x Bb.Objective: Test your hypothesis using chi square analysis. In this set, because only two values (traits) are examined, the degrees of freedom (df) is 1. SHOW ALL WORK!
in a dihybrid cross of two heterozygous black eyed lizards,,the expected totals are 75 black eyed and 25 white eyed by the following Punnett Square:
Figure 21:
From this, I can derive the following equation:
Figure 22:
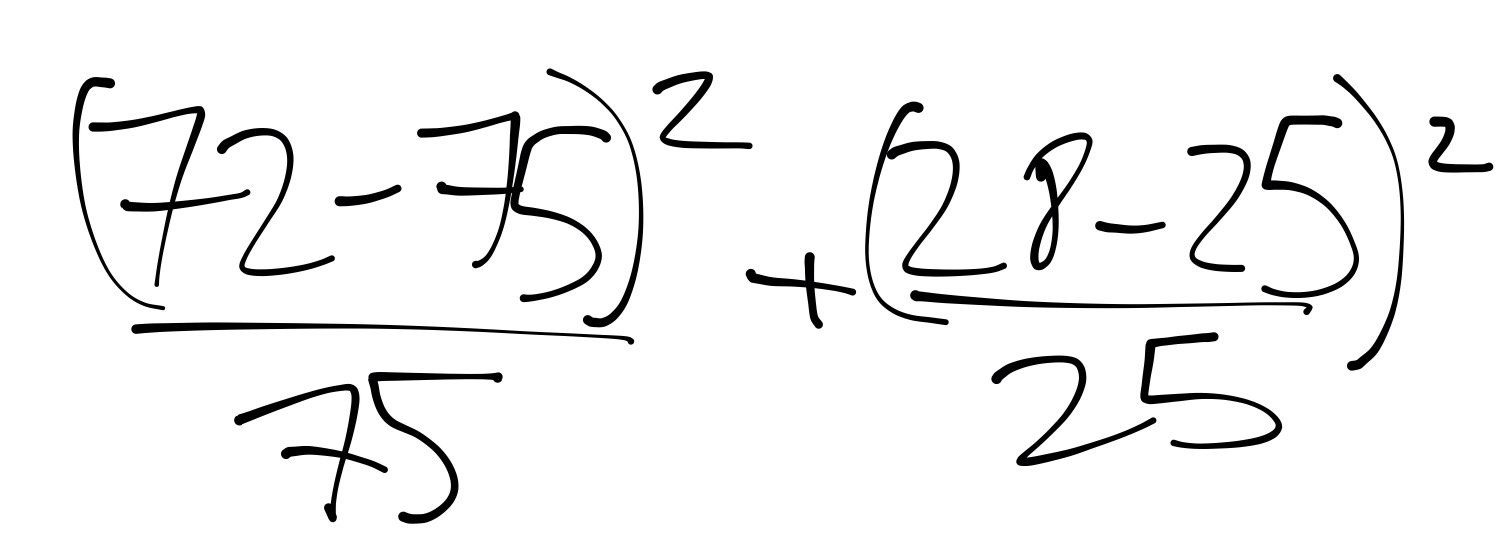
This results in 0.36+0.12, or 0.48.
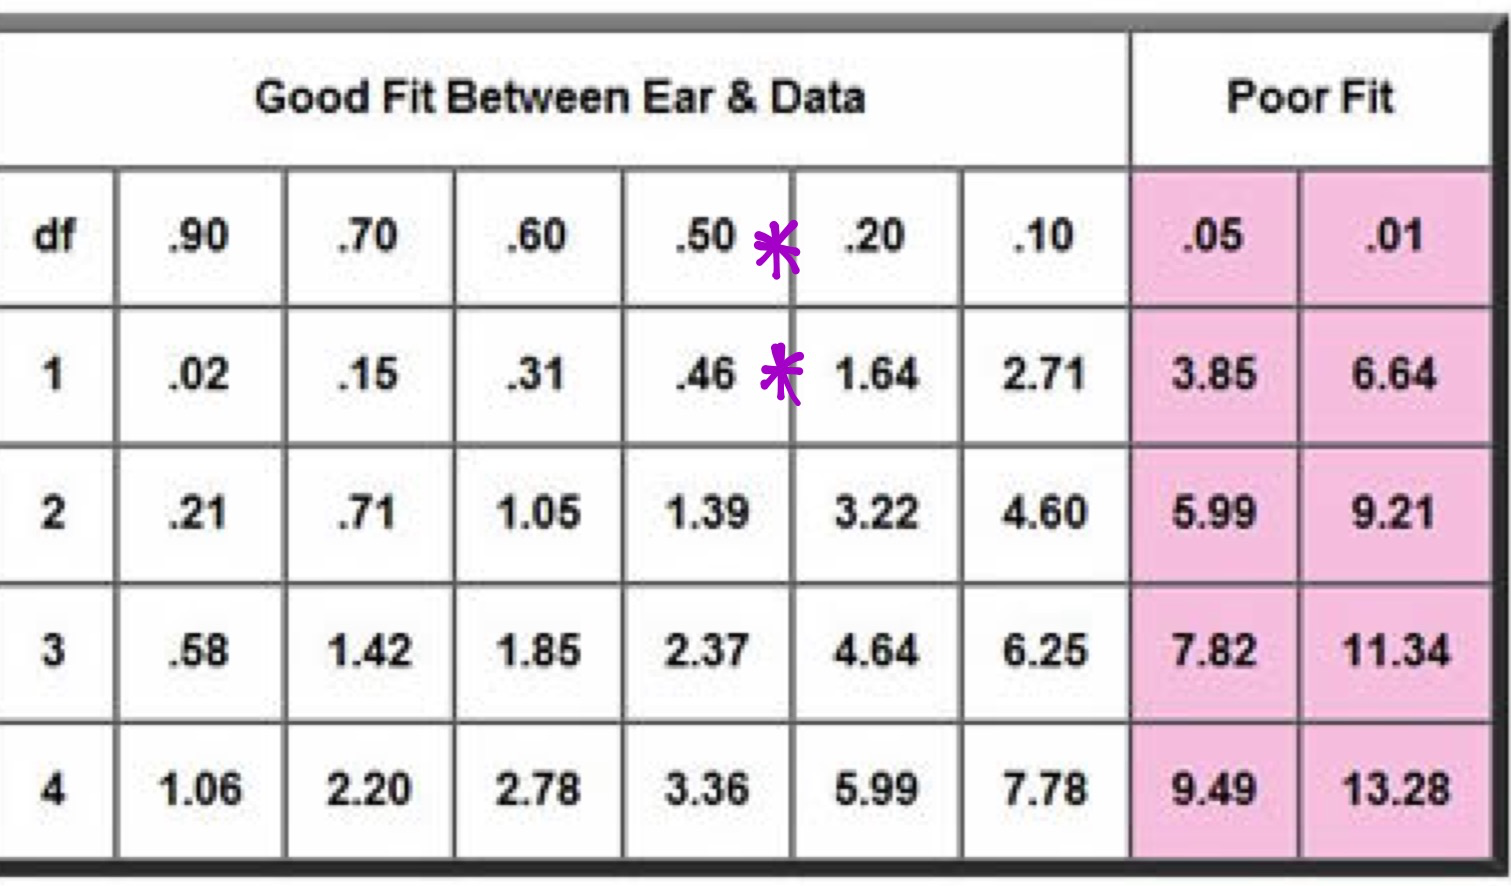
This is classified as a good fit, on the Chi Square Below (Figure 23), with a variance of 1
Figure 23:
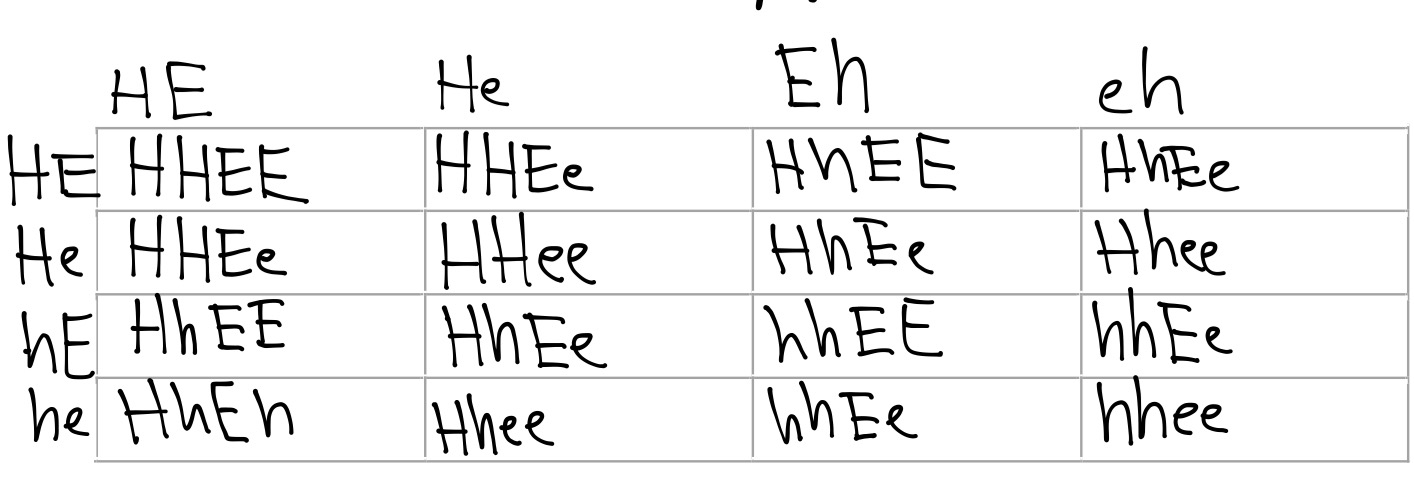
3. Problem: A sample of mice (all from the same parents) shows 58 Black hair, black eyes 16 Black hair, red eyes 19 White hair, black eyes 7 White hair, red eyes Your tentative hypothesis: (what are the parents?)
Objective: Use a chi square analysis to support your hypothesis
I hypothesis that the parents are heterozygous black hair, black eyes.
The following Punnett Square, in which H is hair color and E is eye color supports my hypothesis:
Figure 24:
There are 100 mice, so
Black Hair and Black Eyes 9/16 of 100 = 56.25
Black Hair Red Eyes 3/16 of 100 = 18.75
White Hair Black Eyes3/16 of 100 = 18.76
White Hair Red Eyes 1/16 of 100 = 6.25
The following Chi Square equation yields the Chi Square Number:
Figure 25:
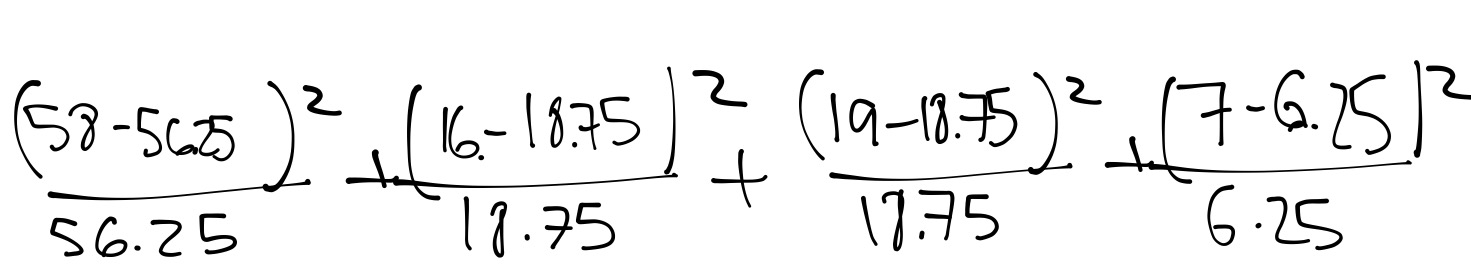
This results in:
.05 + .40 + .003 + .09 = .54
This correlates to a good fit in the 90th chance percentile:
Figure 26:
In this lab, I was able to apply the Chi Square and Mendelian Genetics to a part of the real world, observing the genotypes and phenotypes of Indian Corn.
In my dihybrid crossed corn kernels the following four categories were present: 137 purple and smooth, 47 purple and wrinkled, 43 yellow and smooth, and 17 yellow and wrinkled. In this cross, our corn had an approximate 9:3:3:1 ratio, slotting above the 90% category on the Chi Square Analysis. In the monohybrid cross, I classified 166 yellow smooth and 49 yellow wrinkled, finding a near expected 3:1 ratio. After comparing our data to the Chi Square, rye dihybrid’s value of 0.400827 with a variance factor of three yielded over a 90% chance the slight differences were due to random chance.
The following are possible sources of error in this experiment: miscalculating the total number of corn kernels, miscalculating the Chi Square Analysis, misidentifying corn kernels, miscounting corn kernels, using the inaccurate Chi Square Equation depicted in Figure 27, and not using Punnett Squares to anticipate the expected numbers of each variety of corn kernel.
Figure 27:

If I were to repeat this experiment, I would use different types of Indian Corn, and examine different phenotypes, such as number of kernels in a row, or whether or not the kernel has a “dent” in it, using it to make a trihybrid or quad-hybrid cross. I would also look at other kinds of specimens, such as flies, or peas, or different varieties of tomatoes, to examine their phenotypes and respective genotypes. Given more time, I would analyze the genetics of a human being by creating a monstrous Punnett Square for human genotypes and phenotypes, and then applying it to Chi Square Analysis.
University of California Berkeley-Biology
http://evolution.berkeley.edu/evolibrary/article/history_13
Dennis O’Niell Palomar University Anthropology
http://anthro.palomar.edu/mendel/mendel_2.htm
Encyclopedia Brittanica
http://www.britannica.com/EBchecked/topic/137741/corn
Stanford University Statistics
http://mips.stanford.edu/courses/stats_data_analsys/principles/chi_table.html
North Dakota State University Biology
http://www.ndsu.edu/pubweb/~mcclean/plsc431/mendel/index.htm
University of South Carolina Orangeburg
http://physics.scsu.edu/~dscott/gen/CornLab.html
University of Indiana Bloomington
http://www.indiana.edu/~l113/labs/fly_genetics/Chi-Square.pdf
Graphs: Create a Graph
nces.ed.gov/nceskids/createagraph/
