Abstract
In this experiment, I investigated slides of root tips and analyzed the phases of mitosis and the relative duration of each phase in the meristem root tissue. An organism’s growth is delicately controlled by regulating the cell cycle. Mitosis is the cell cycle process in which nuclear division and cytokinesis form two identical daughter cells.
Introduction and Background
In the early 1880s, the German anatomist Walther Flemming observed the fibrous structures of spindle fibers and created the term mitosis, from the Greek word for thread, to describe the actions of spindle fibers in a dividing cell.
To study the process of mitosis, I examined cells from the meristem root tissue of an onion, in which many cells are undergoing the process of mitosis. Mitosis is the process of nuclear division and cytokinesis to form two identical daughter cells.
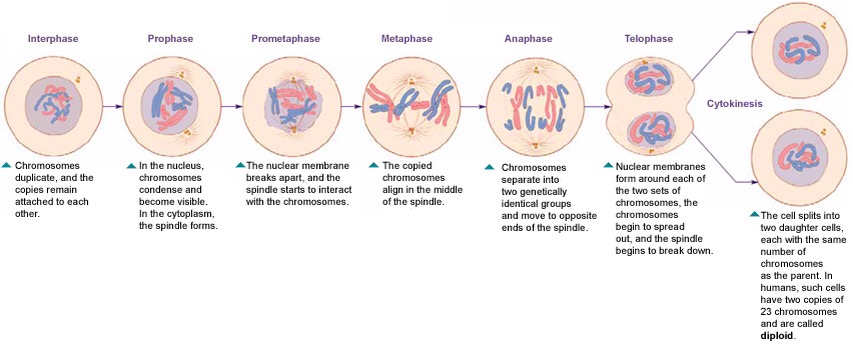
Mitosis consists of the following stages: interphase (although not technically considered part of mitosis, it is the precursor to mitosis), in which the chromosomes duplicate and the cell readies itself for mitosis; prophase, in which chromosomes condense and spindle fibers form; prometaphase, when the nuclear membrane disintegrates; metaphase, when the chromosomes line up one the middle of the spindle fibers with the centromere attached to the spindle; anaphase, in which the chromosomes separate and migrate towards the asters; and telophase, when nuclear membranes begin to form around the chromosomes on both sides of the cell. During telophase, the chromosomes condense and the cell prepares for cytokinesis, in which the cell splits into two identical daughter cells. Interphase and the stages of mitosis are seen in Figure 1 below.
Figure 1:
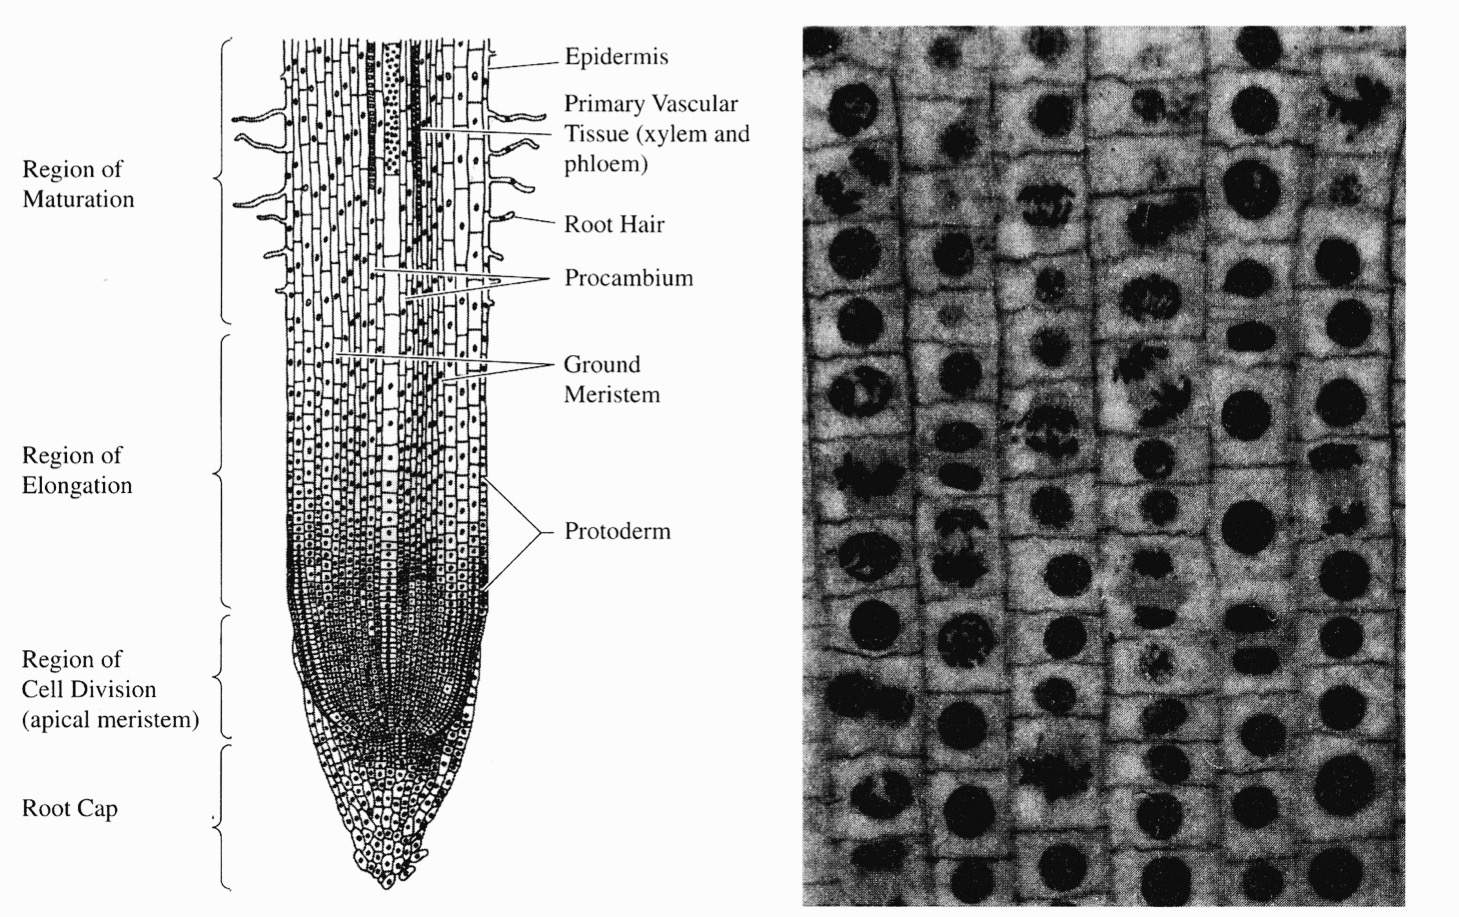
I used onions in this experiment due to the high percentage of cells that undergo mitosis in an onion’s apical meristem root tissue. This tissue is located towards the end of the root, near the root stem. The location of the apical meristem root tissue is displayed in Figure 2 below.
I used whitefish blastula in this experiment because of its rapid rate of nuclear division from fertilization. This rapid division allows one to visualize spindle fibers very clearly in the cell.
Figure 2:
The duration of the stages of mitosis can be determined by counting the number of cells in mitosis at a given time and multiplying that value by the average duration of mitosis in an onion, which is approximately twenty-four hours.
I hypothesized that a majority of cells would be in interphase, because of the time required to synthesize new DNA molecules during the S stage.
Materials and Procedure
Materials List
–1 Light Microscope, outfitted with a 10X eyepiece and 4X, 10X, and 40X objective lens
–Prepared Microscope Slide of 3 Onion Root Tips
–Prepared Microscope Slide of Whitefish Blastula
Procedure
Part One: Observing Mitosis in Plant and Animal Cells
1. I brought the microscope into focus on the lowest 4X setting with the onion root tip in view, making sure the diaphragm was at its widest setting.
2. I located the meristem root tissue of the onion root tip and switched the microscope to the 40X measure, in which cells were visible.
3. I identified and classified the cells based on their stage in mitosis: interphase, prophase, prometaphase, metaphase, anaphase, and telophase, as depicted below in Figure 3 and Figure 4
Figure 3:
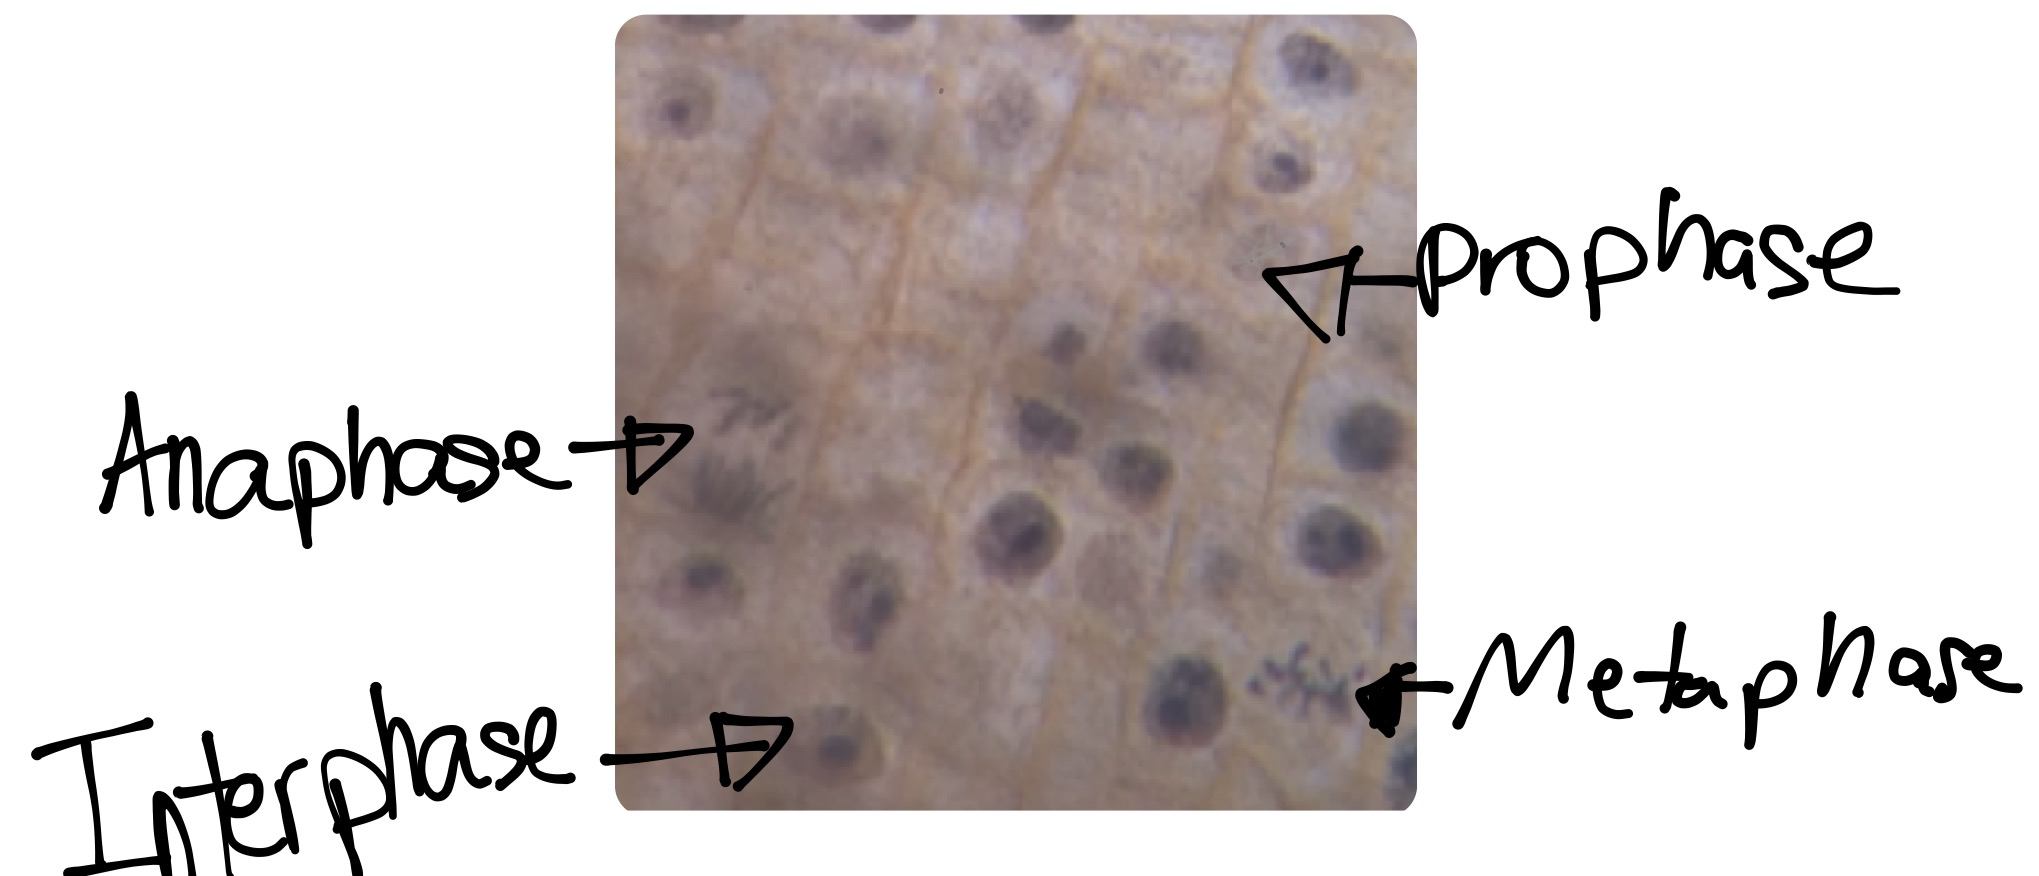
Figure 4:
4. I looked in all three onion root tips to find all of the stages of mitosis.
5. Steps 1-4 were repeated using the whitefish blastula, which is an animal cell.
Part Two: Determining the Rate of Mitosis in Plant and Animal Cells.
1. I focused the microscope on the 4X setting with the onion root tip in view, making sure the diaphragm again was at its widest setting.
2. I located the meristem root tissue of the onion root tip and changed to the 40X high power lens, so the cells of the onion root were visible.
3. Using the first onion root’s meristem root tissue, I found a large collection of cells in many stages of mitosis.
4. I counted the number of cells in each stage and recorded the values in my data table.
5. I repeated steps 3 and 4 twice, each time using a different onion root tip to locate the cell clusters.
6. I totaled the number of cells in each stage in the three microscope views, and determined the percentage of the total number of cells in each stage.
7. I multiplied the percent of the total number of each cell in a phase by 1440, the number of minutes in a day, which is the time an onion cell takes to undergo mitosis. This product is approximately equal to the time a cell spends in each stage of mitosis.
Results
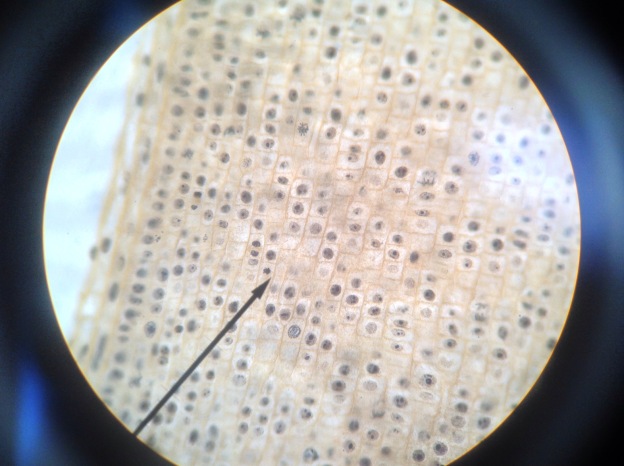
Figure 5
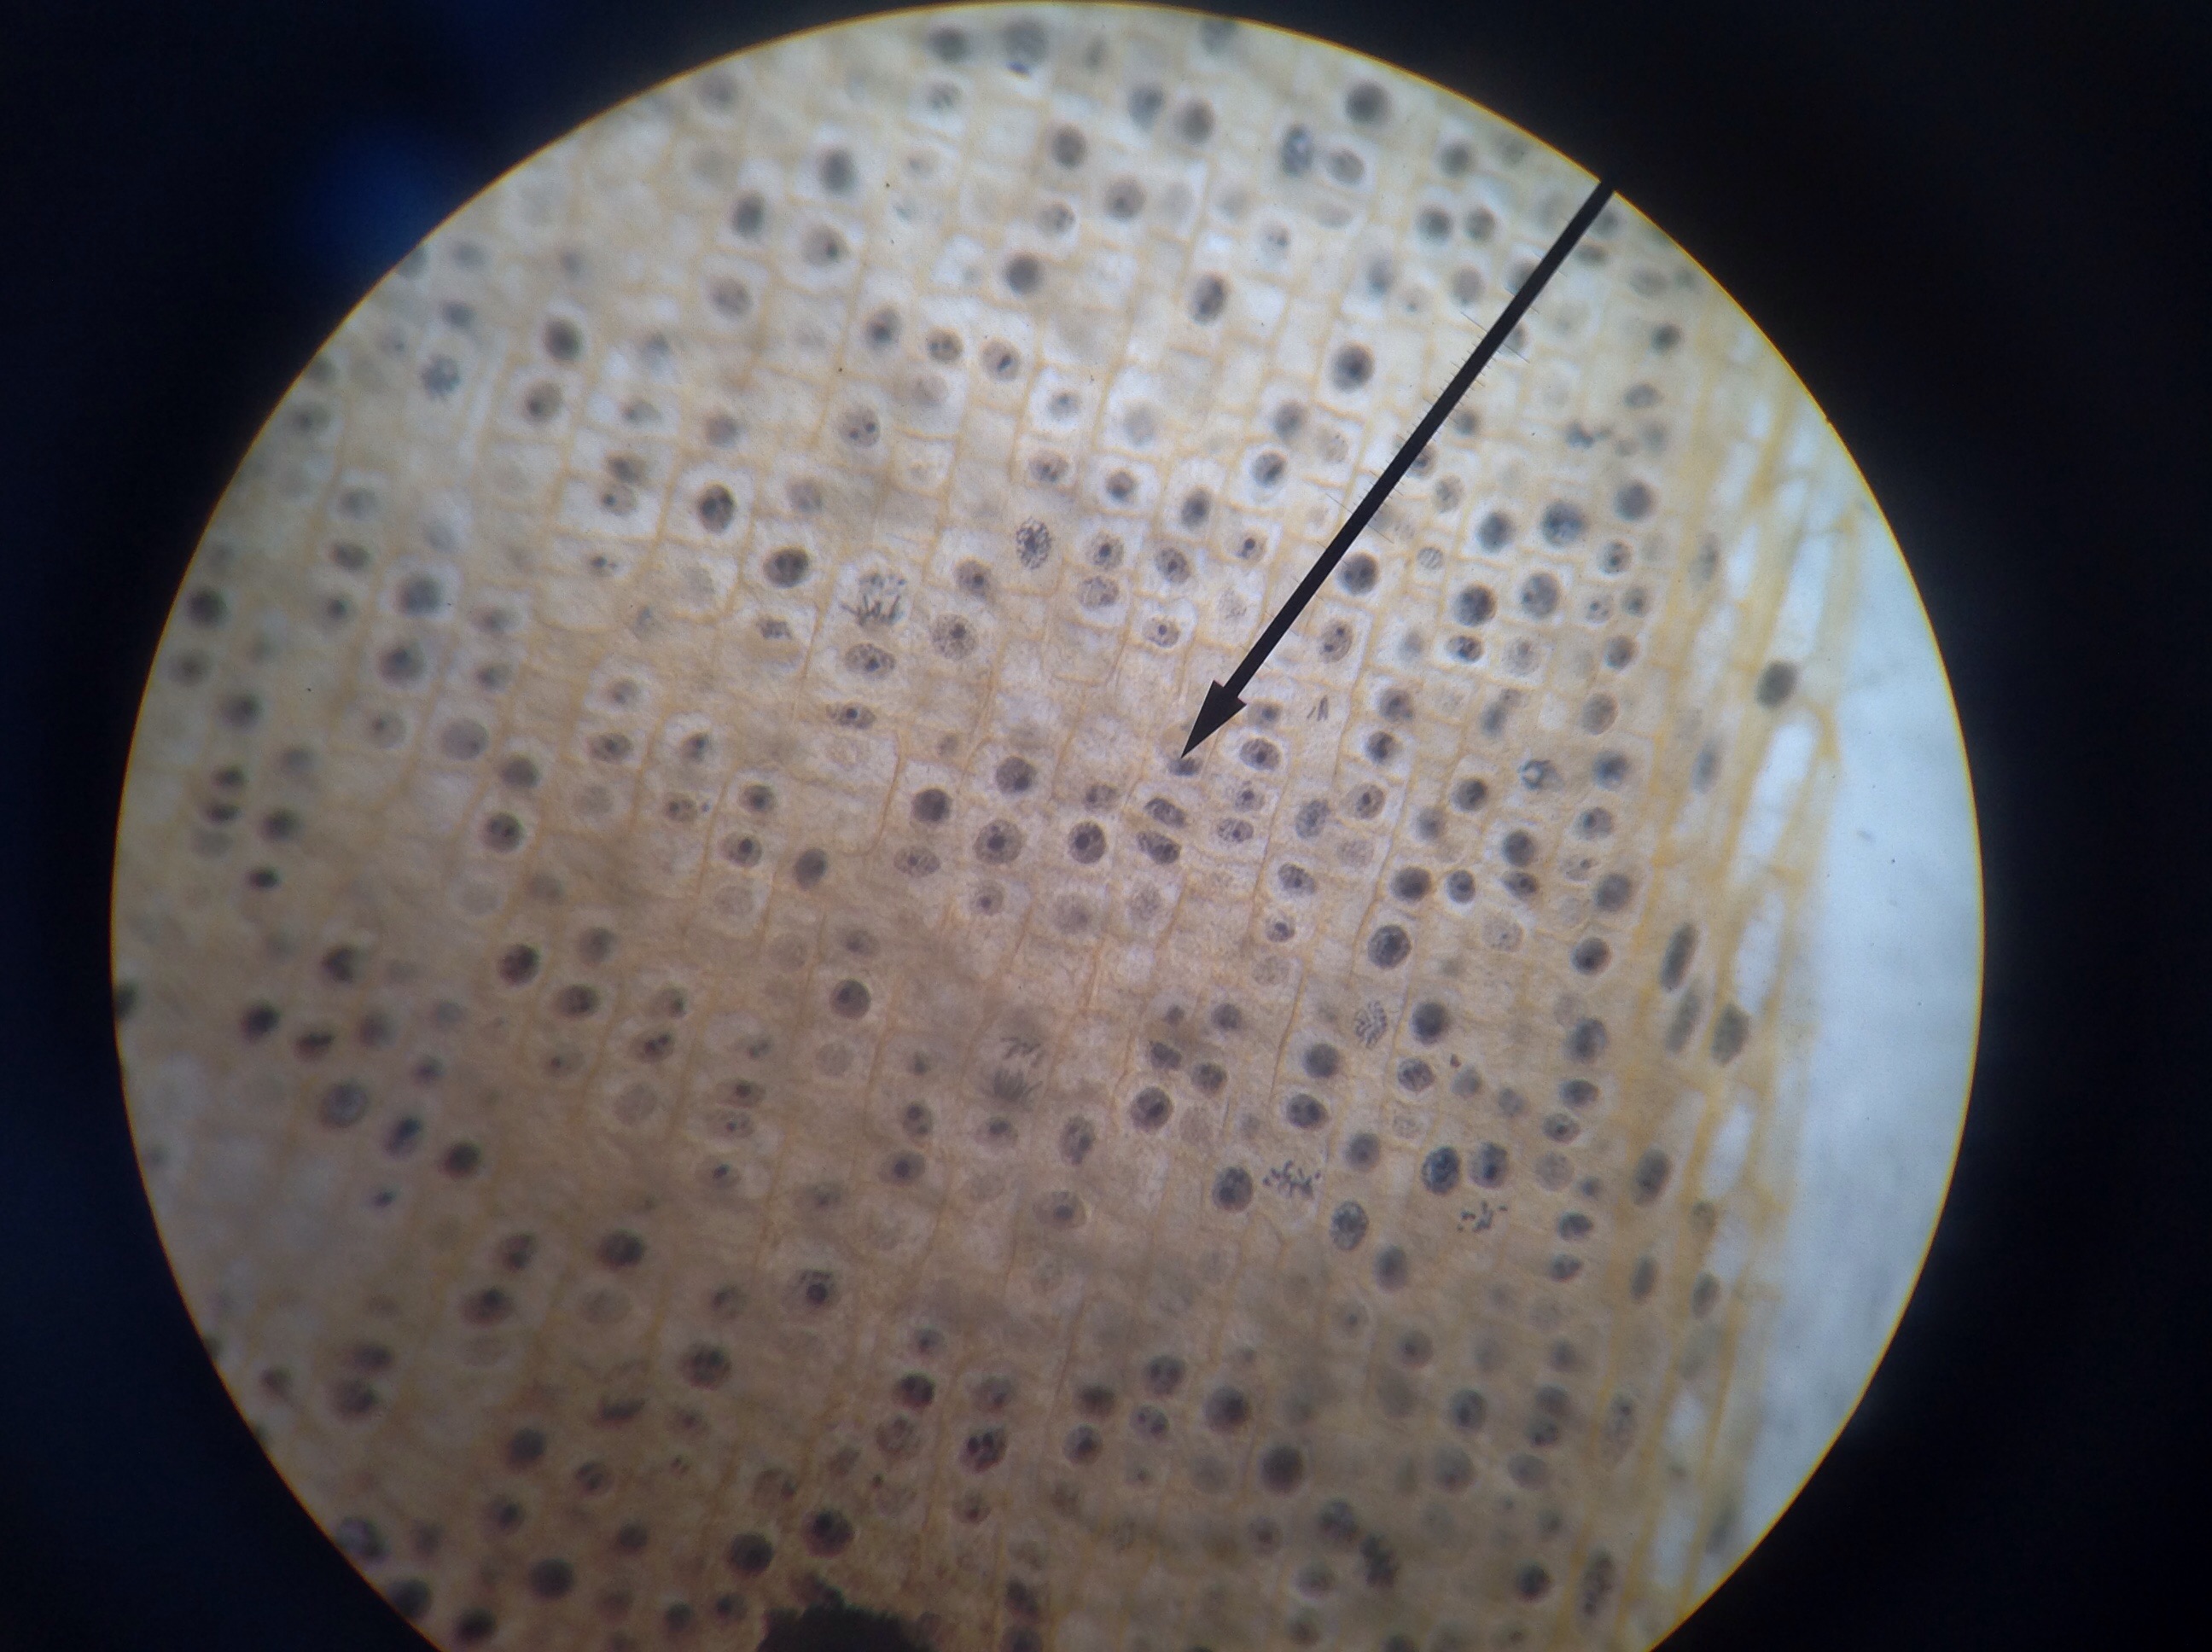
As seen in Figure 5, I observed many cells in an onion root tip under the 40X lens. A majority of the cells are in interphase; however, several are in prophase, metaphase, and anaphase.
Figure 6
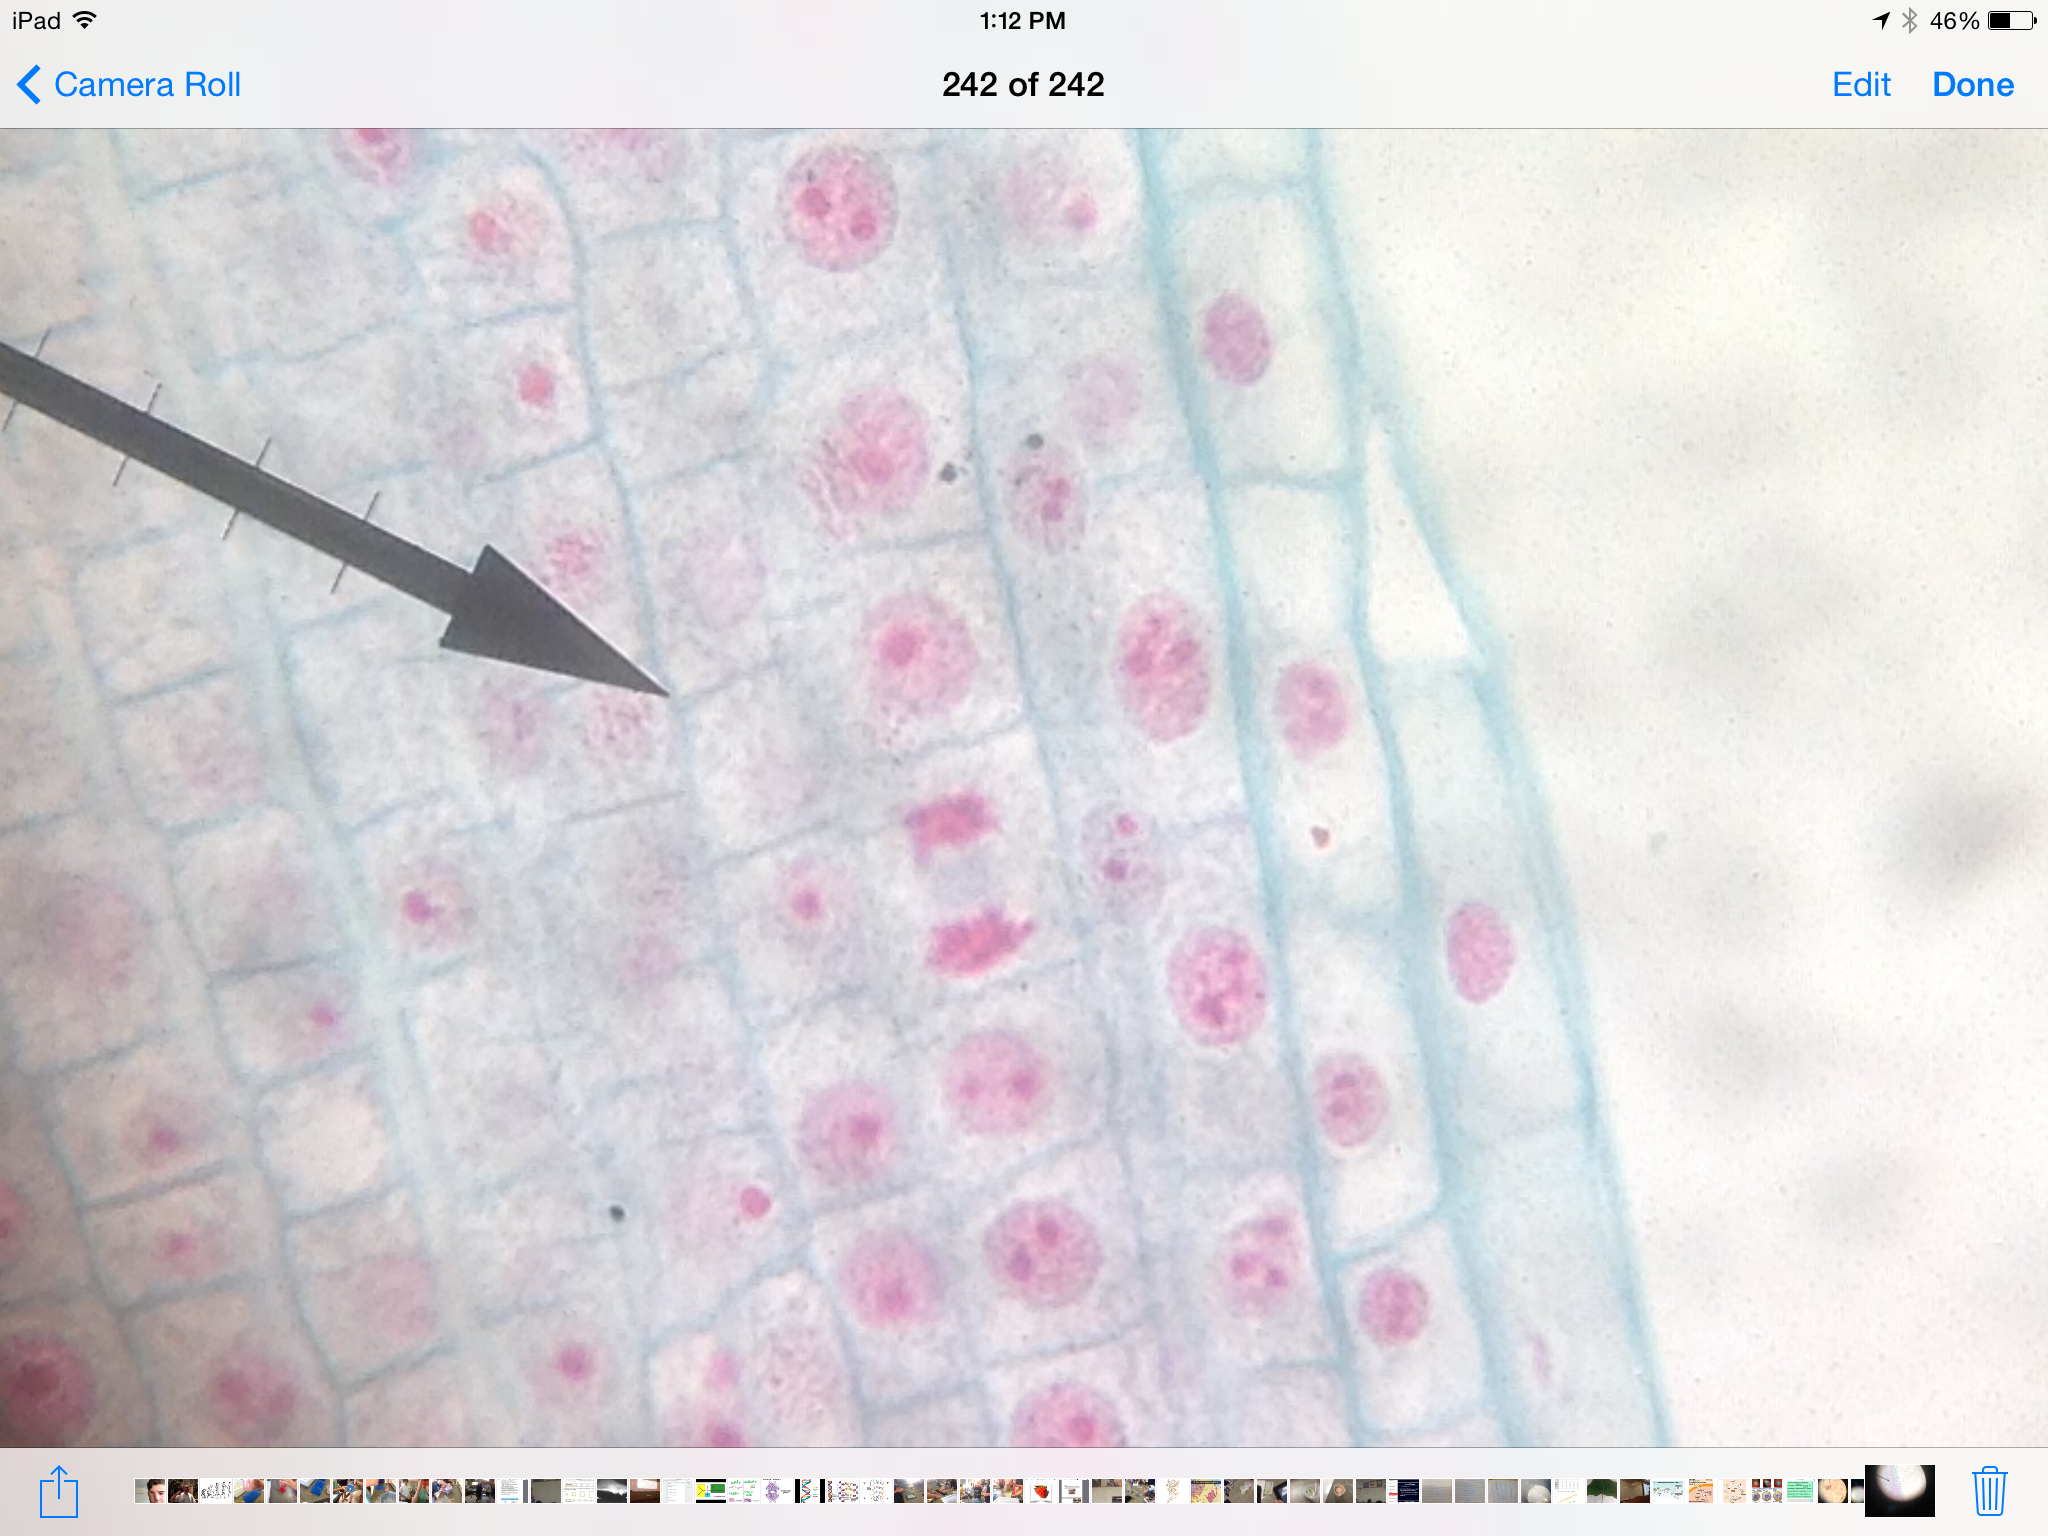
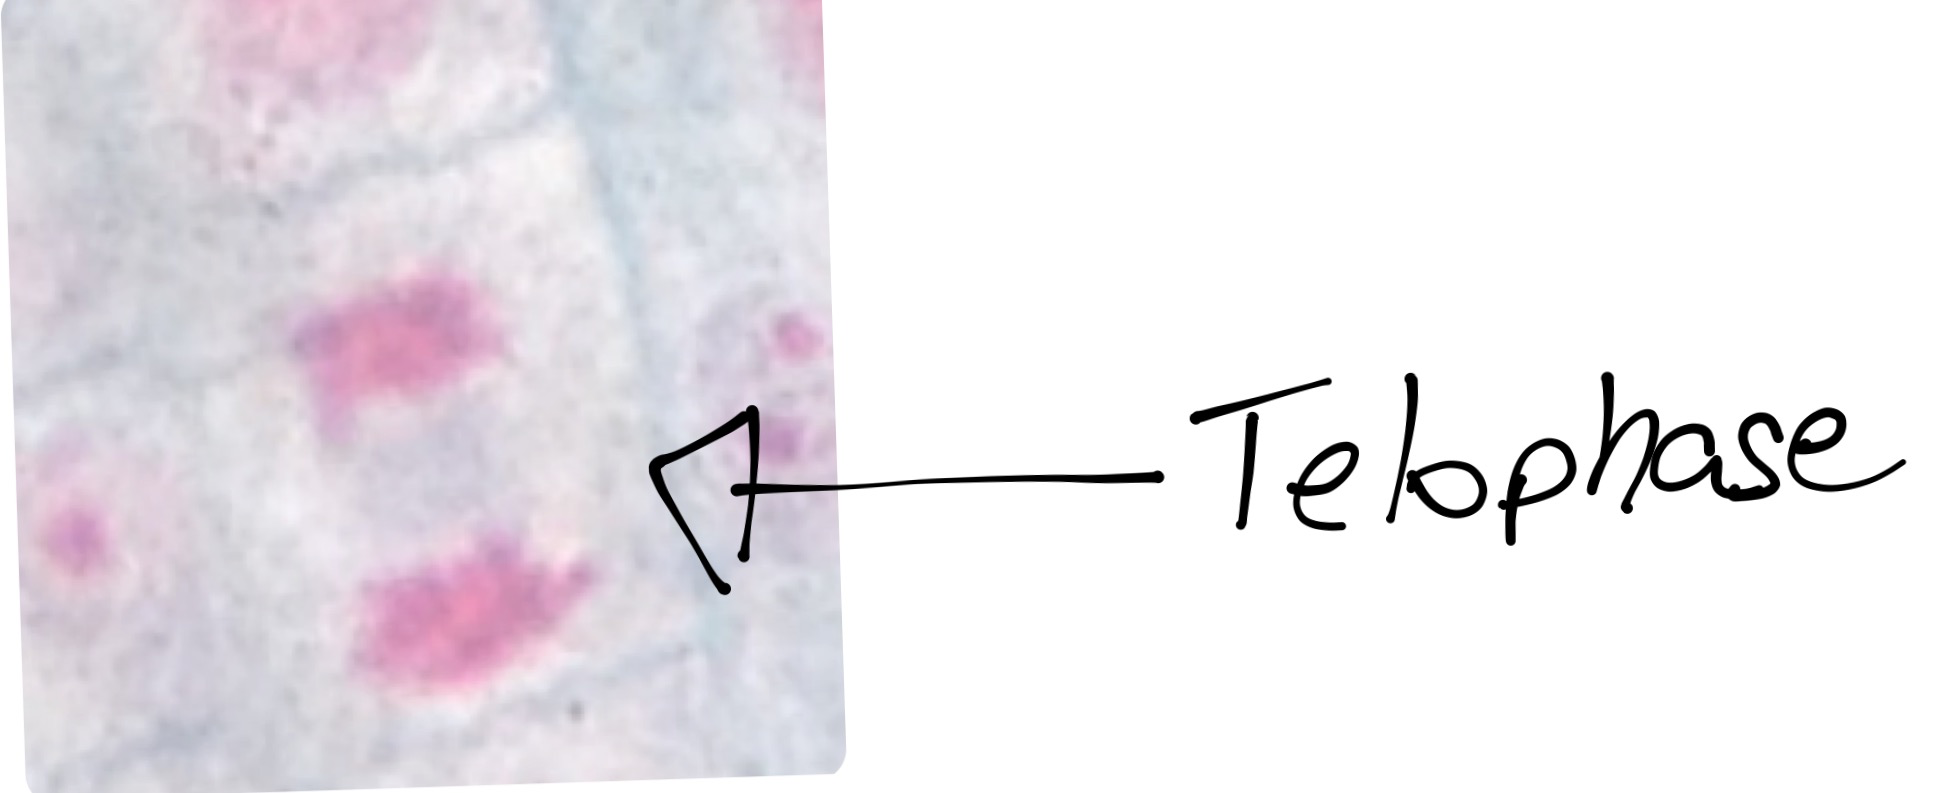
As seen in Figure 6, I observed the cells in another slide of onion root tips. These cells were stained blue and red, in contrast to the cells in Figure 5. In this slide, a majority of cells are in interphase, and a notable telophase is seen in the center.
Figure 7
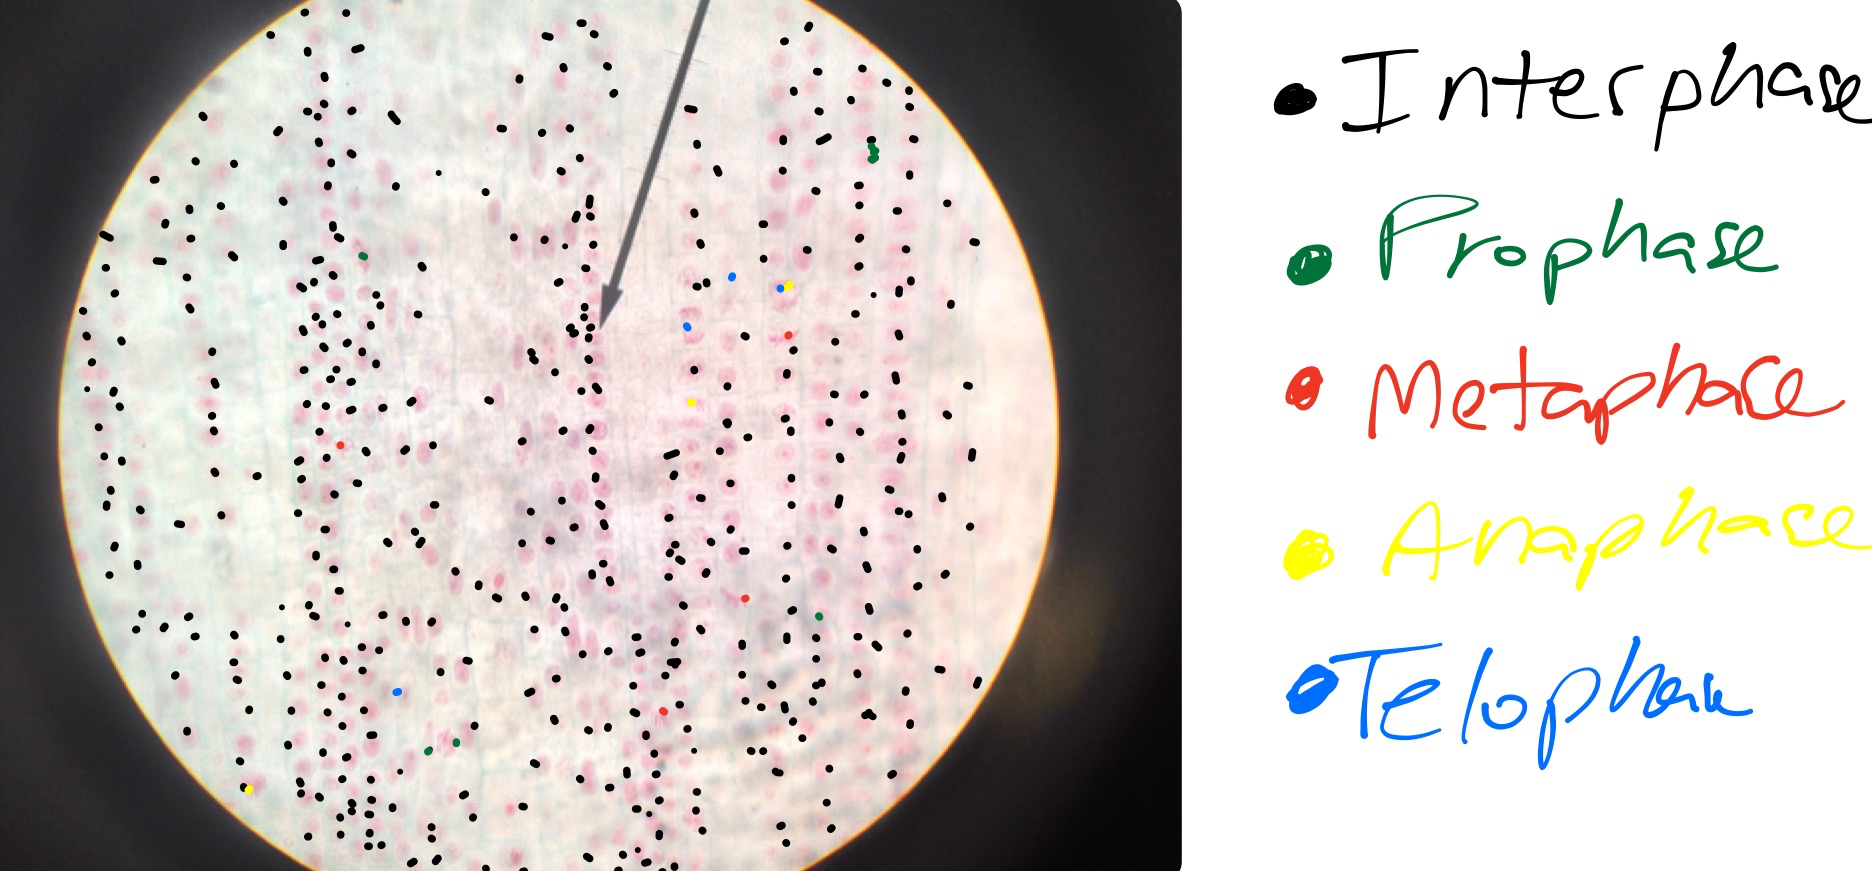
As seen in Figure 7, I identified the cells by stage of the cell cycle, with black representing interphase, green prophase, red metaphase, yellow anaphase, and blue telophase. A majority of the cells (376) are in interphase, representing ninety-six percent of the total cells in view. I noticed slight differences among the interphase cells, which represent the many stages of interphase: G1, S, and G2.
Graph 1
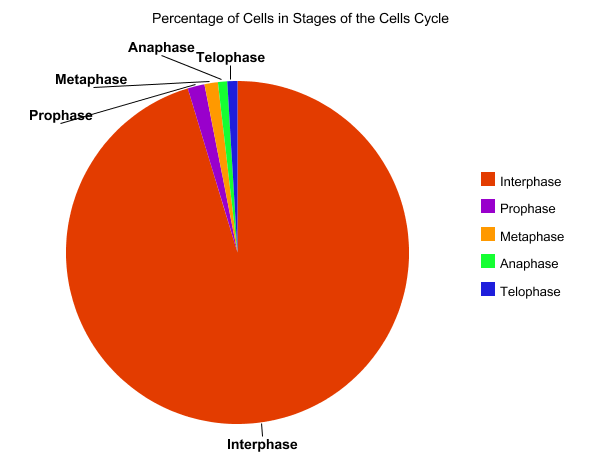
As seen in Graph 1, a pie chart represents the total percentage of cells in each stage of the cell cycle. Interphase accounted for 95.31 percent of the cells, followed by prophase with 1.58 percent, metaphase with 1.27 percent, telophase with 0.95 percent, and anaphase with 0.87 percent.
Graph 2
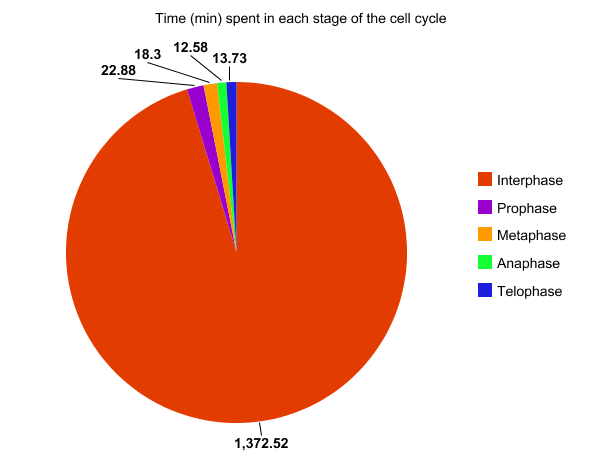
As seen in Graph 2, this pie chart represents the total number of minutes per cycle a cell spends in each stage. Cells spend most of the time in interphase, a total of 1372.52 minutes, or 22 hours and 52 minutes.
Table 1
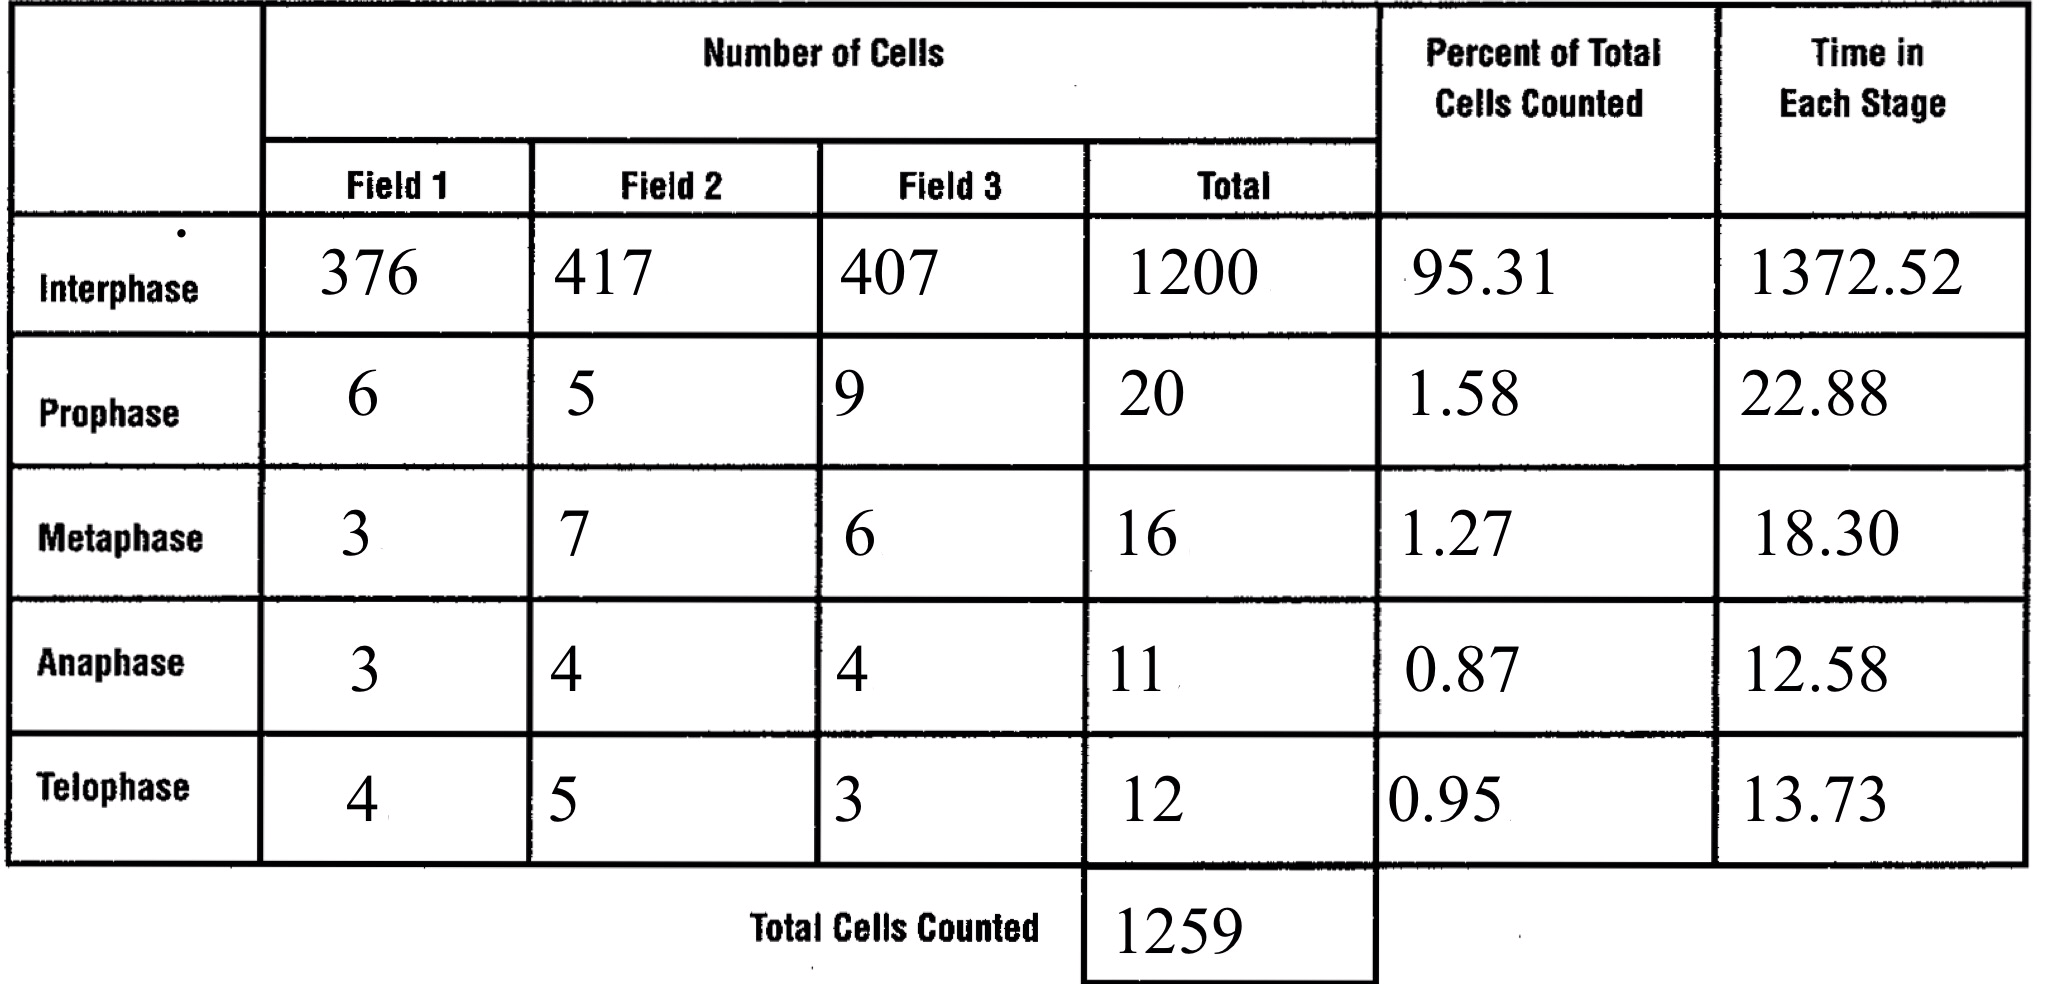
Table 1 tabulates the total number of cells counted in part two of the experiment. I counted 1200 in interphase (95.31%), 20 in prophase (1.58%), 16 in metaphase (1.27%), 11 in anaphase (0.87%), and 12 in telophase (0.95%).
Discussion Questions and Conclusion
1.) Why is it more accurate to call mitosis nuclear replication rather than cell division?
*It is more accurate to call mitosis nuclear replication instead of cell division as the actual division of cells occurs during cytokinesis, not mitosis. Only the nucleus is replicated during mitosis, and it migrates to the ends of the cell. However, the cell has not yet divided.
2.)Explain why whitefish blastula and onion root tips are selected for a study of mitosis.
*The whitefish blastula is used because the rapid growth of cells and frequent cell division allows for observation of the various phases of mitosis. A blastula is a spherical arrangement of cells, like a zygote, that results from fertilization. Onion root tips are used because the growth of the roots occur in the root tips, which results in many cells going through mitosis.
3.) If your observations had not been restricted to the area of the root tip that is actively dividing, how would your results differ?
*If I observed areas of the root that were not actively dividing, I would have found few or no cells in prophase, metaphase, anaphase, or telophase. Instead, the cells would have been growing during interphase. In addition, my measurement of time spent in the cell cycle phases would have been less accurate due to the small fraction of dividing cells.
4.)Based on the data in table 3.1 what can you infer about the relative length of time an onion root-tip cell spends in each stage of cell division?
* Based on the data in table 3.1, I can determine that a cell spends a majority of its time in cell division during interphase. In mitosis, a cell spends most of its time in prophase, followed my metaphase, telepath and anaphase, respectively.
In this experiment, I was able to study mitosis and the stages of the cell cycle by observing and identifying the stages under a microscope. Calculating the total amount of time that cell spends in each phase of the cell cycle helped me understand the relative time a cell spends in mitosis and interphase. In addition, I proved my hypothesis correct, as a majority of the cells I identified were in interphase.
As this experiment involved observing cells, possible sources of error include the misidentification of cells. I found it difficult to distinguish cells in anaphase from cells in telophase, which may have affected my results. Furthermore, due to the large number of cells in interphase, it is possible to incorrectly count the interphase cells in the field of view. Other possible errors include viewing the onion root tip in a region other than the apical meristem, in which one would observe almost all cells in interphase due to the low rate of mitosis.
If I were to repeat this experiment, I would try to determine if different varieties of onions had different rates of mitosis in their apical meristem tissue. Another possible experiment would be to use the roots of an unwatered onion plant, with roots that lacked the nutrients needed to grow, to see if poor nutrition affects the rate of mitosis. I would also like to experiment with meiosis using a chromosome replication kit. From this experiment, I could compare my results from both processes, and determine the similarities and differences between the two. A final experiment is to use different varieties of plant and animal cells with different rates of growth in order to determine how long it takes their cells to complete the cell cycle.
References
University of Arizona-Biology
http://www.biology.arizona.edu/cell_bio/tutorials/cell_cycle/main.html
Marietta Univeristy, Marietta, Georgia
