In this lab, I studied the effects of the concentration of catalase on enzymatic activity. I found that a greater concentration of enzyme leads to a greater rate of reaction. The lab measured the rate of the formation of oxygen via the breakdown of hydrogen peroxide. The catalase reaction is very important in cells because it stops the accumulation of hydrogen peroxide, which is lethal to the cell. I hypothesized that as the concentration of the enzyme increased, so would the quantity of the products.
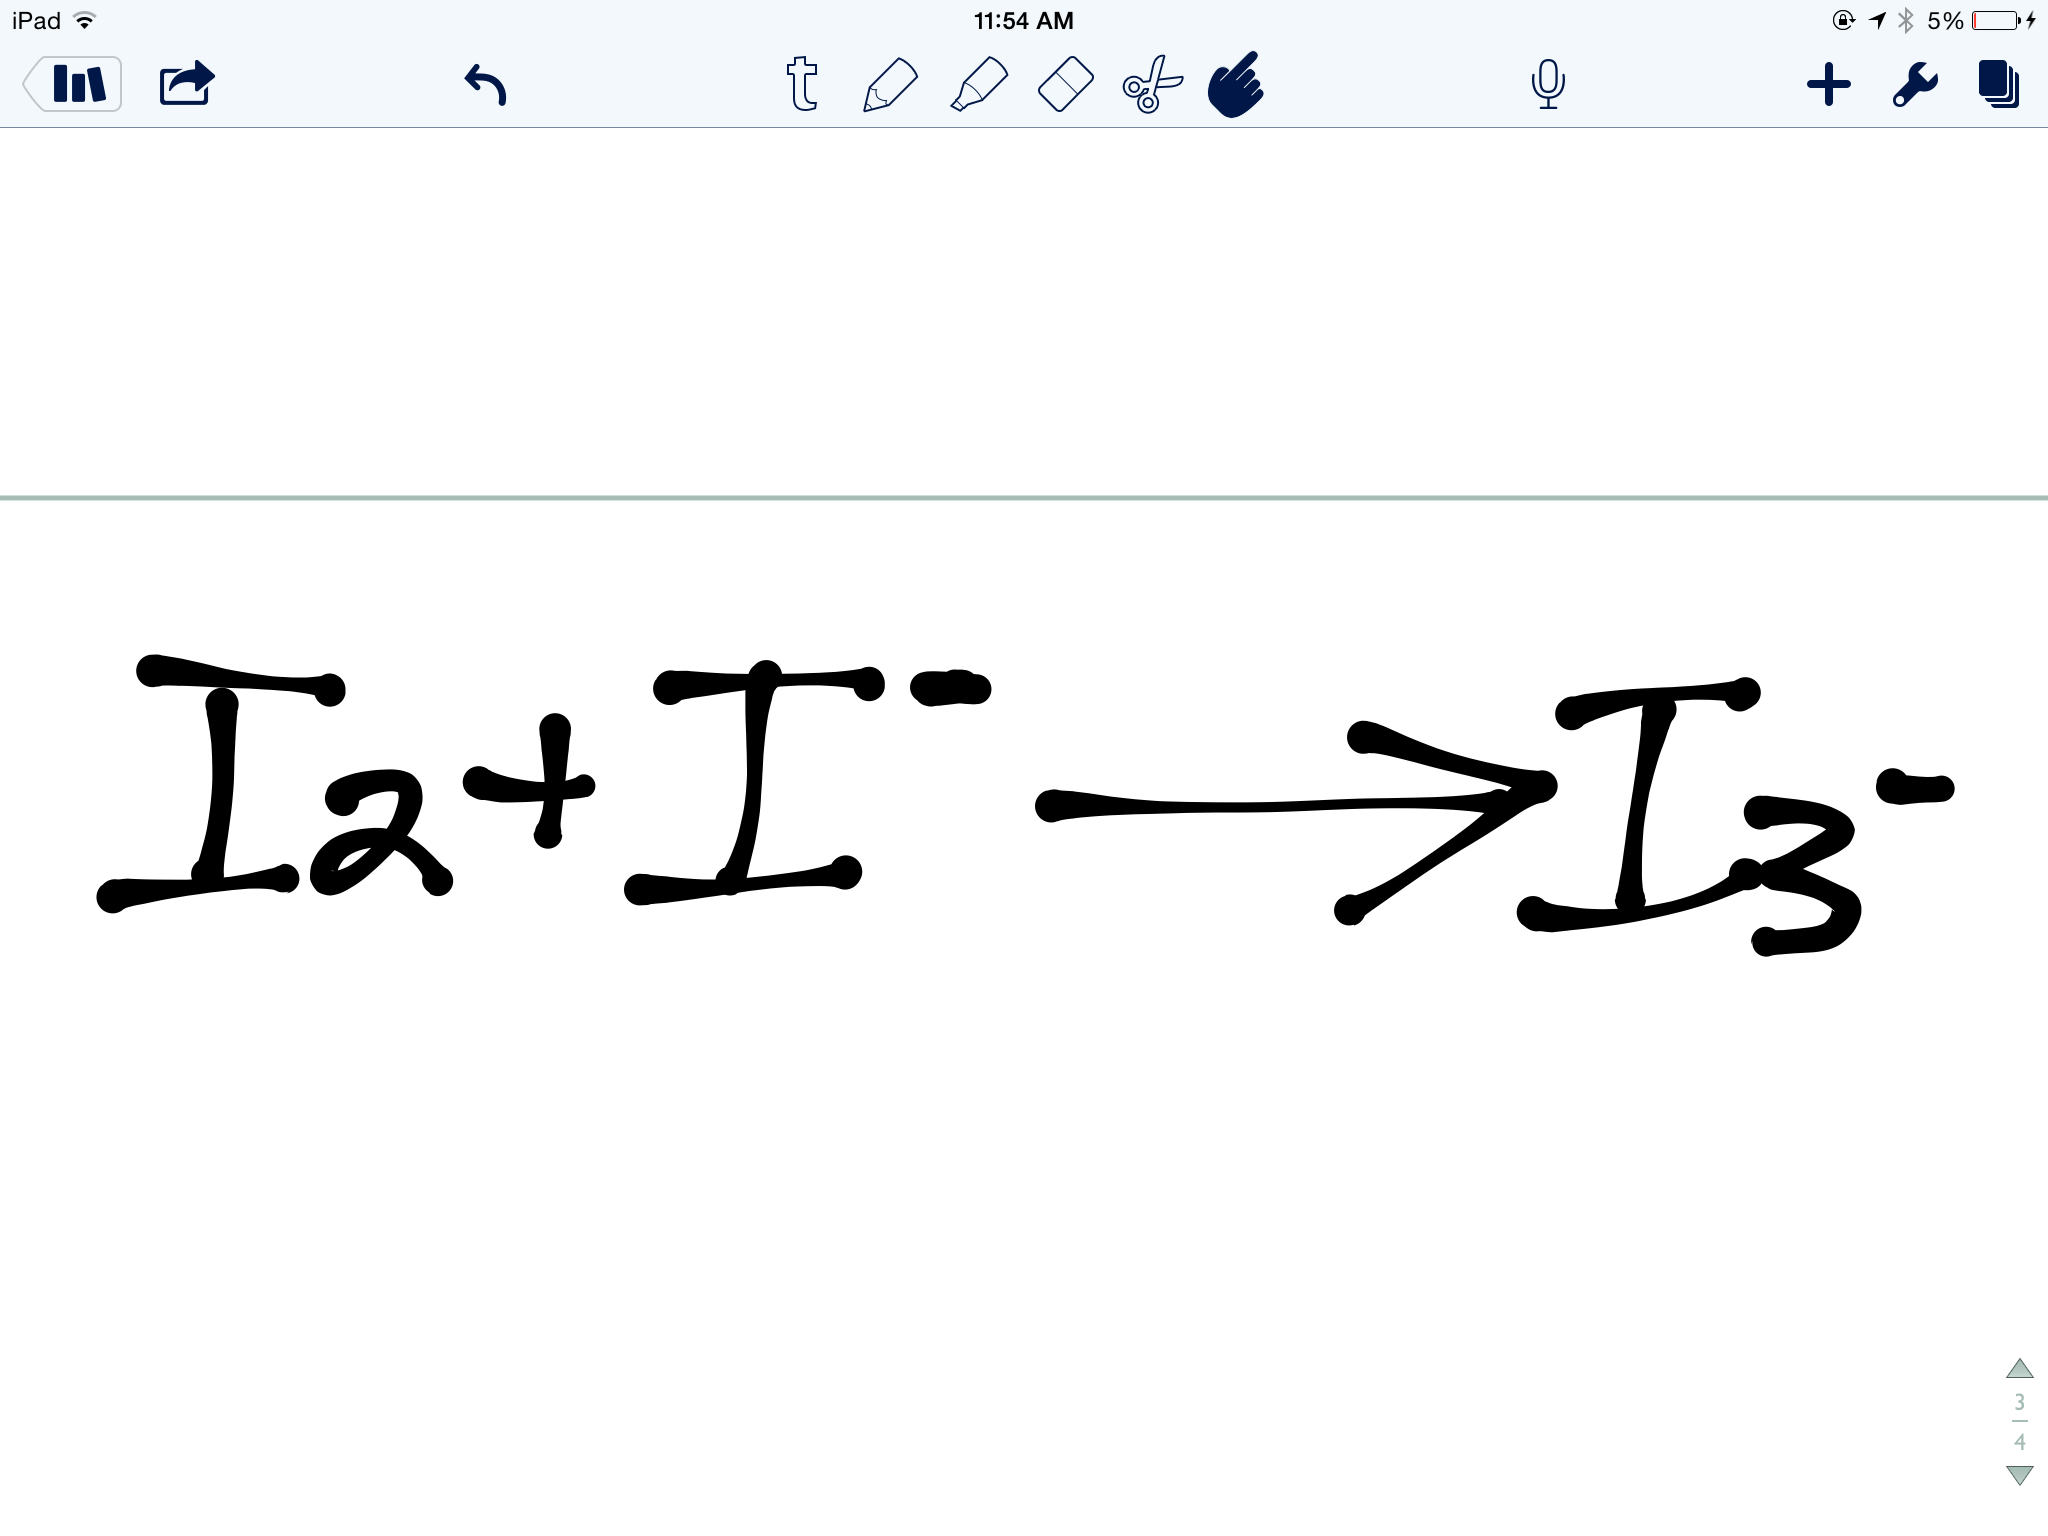
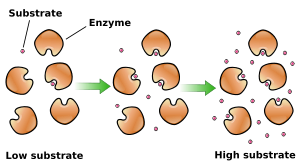
Enzymes such as catalase are catalysts that execute thousands of chemical reactions that occur in living cells. In an enzyme catalyzed reaction, the substrate (the substance to be acted upon), binds to the active site of the enzyme. The enzyme then changes the substrate into the reaction products. The product is then released into solution and the unchanged enzyme is ready to make another enzyme-substrate compound. Both the enzyme concentration and the substrate concentration can affect the reaction rate. The presence of more molecules increases the probability of collisions and enzyme substrate coupling. In this lab, the enzyme catalase accelerated the breakdown of hydrogen peroxide, which is summarized in this reaction.
Figure 1
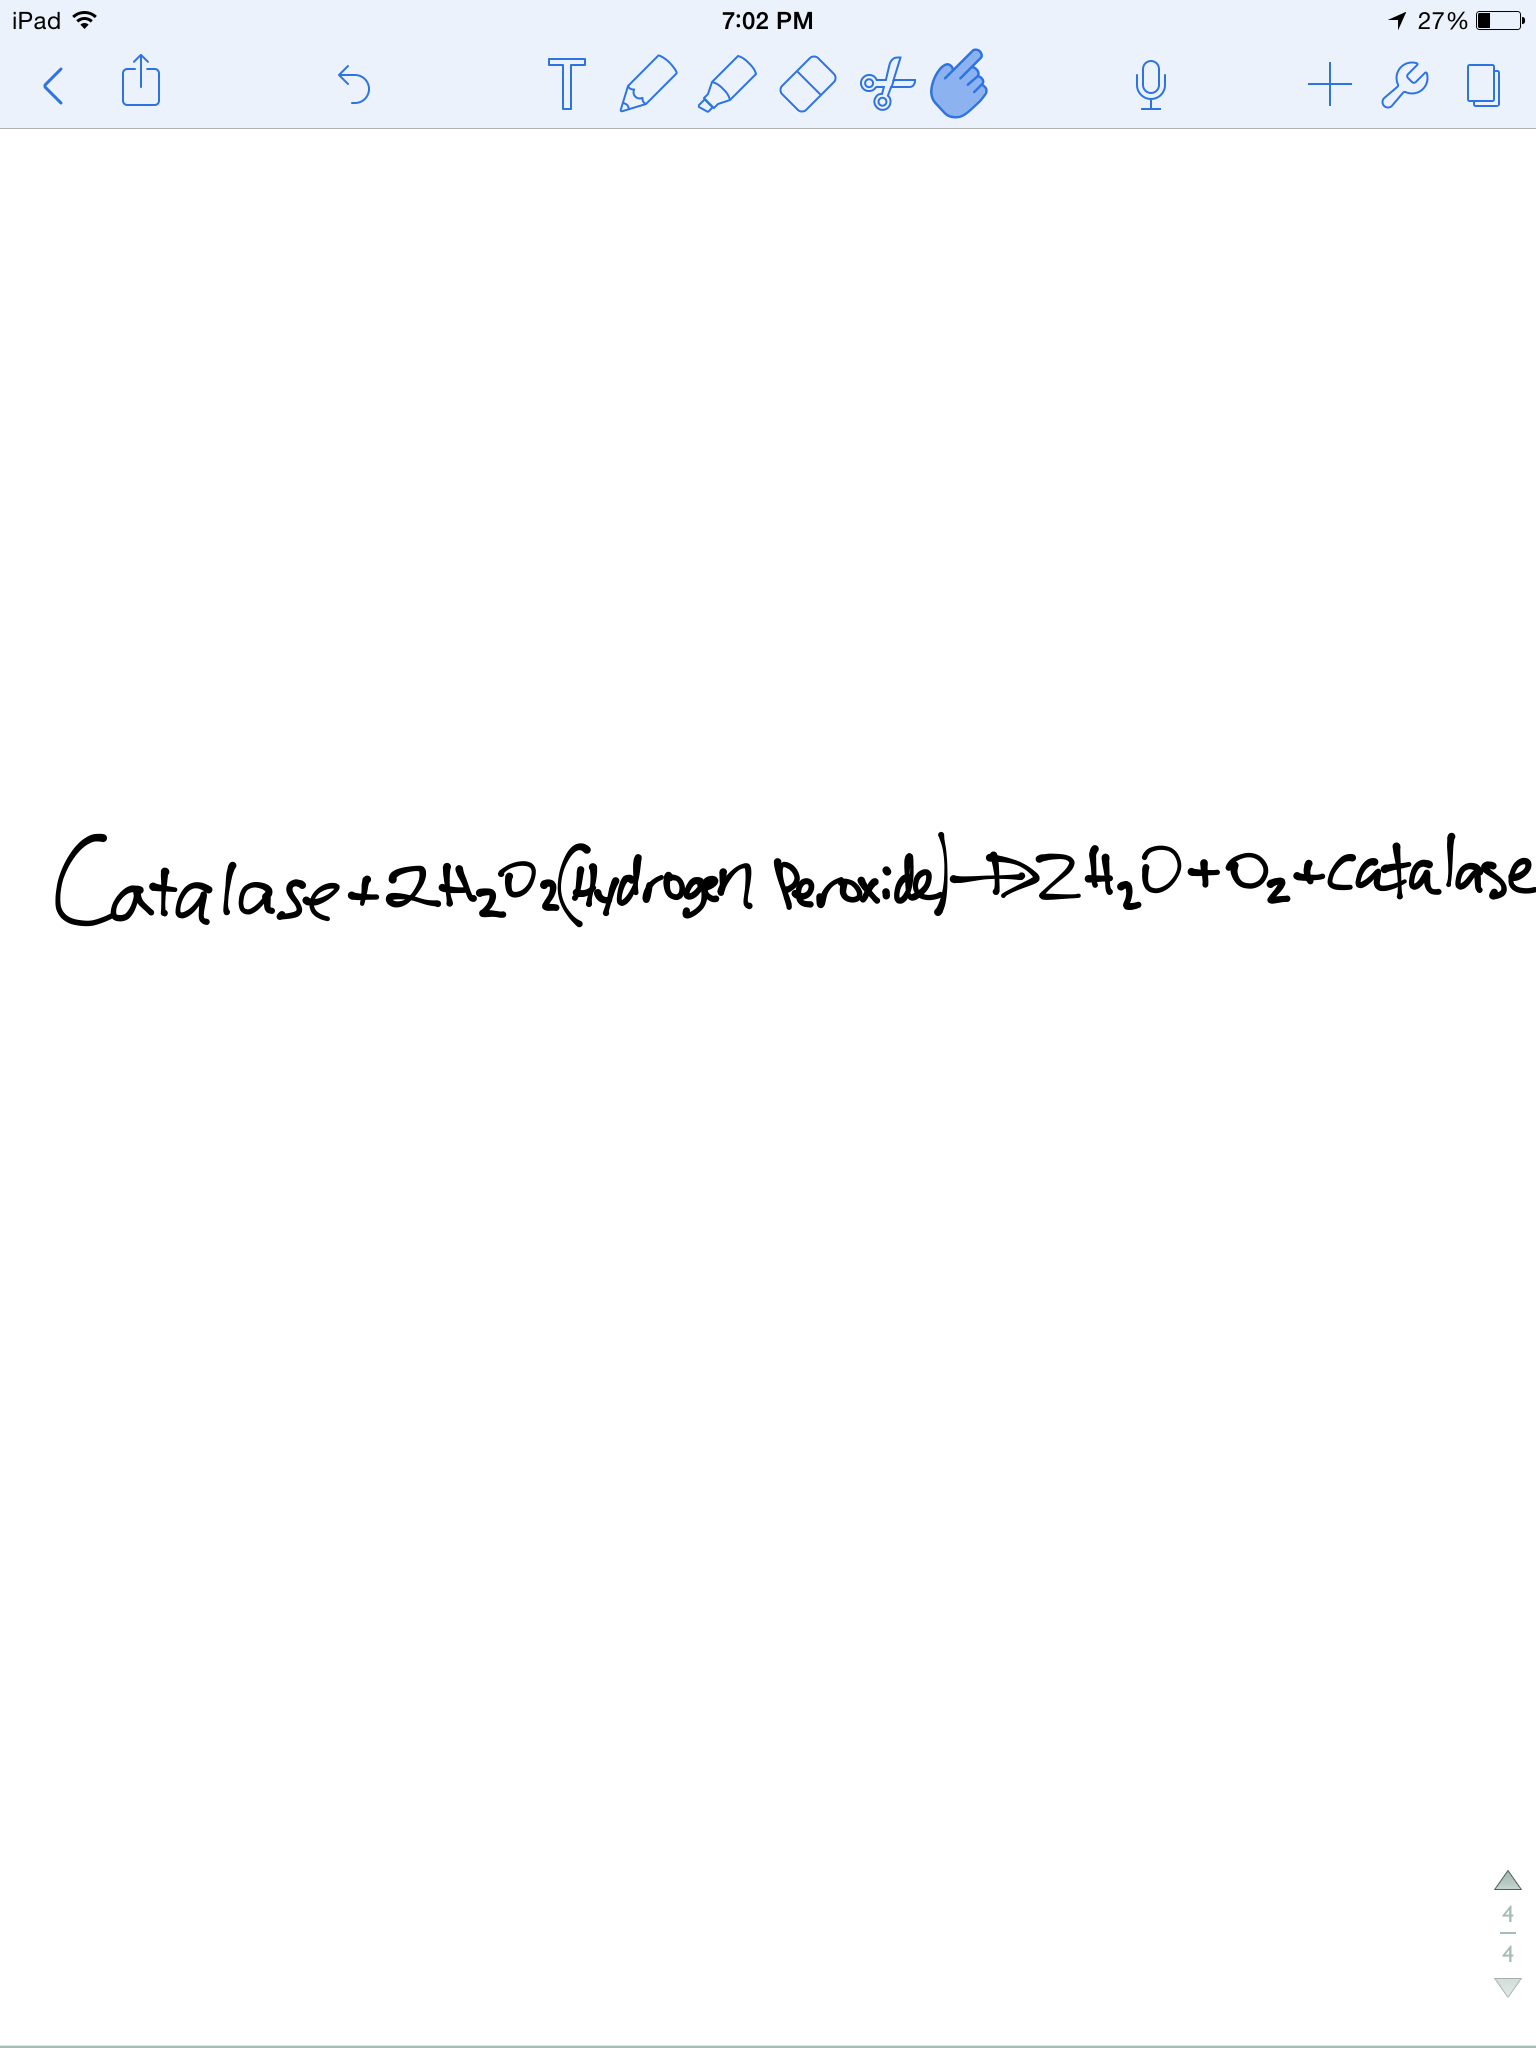
This reaction is critical in living cells, because it stops the accumulation of hydrogen peroxide, which is lethal to the cell. Hydrogen peroxide is a harmful byproduct of many normal metabolic reactions. In order to prevent damage to the cell, it must quickly be changed into less harmful substances. Therefore, the presence of catalase is important because it breaks down a potential toxin.
Catalase is also used in the production of cheese, as hydrogen peroxide is a byproduct of the cheese-making process, and it must be removed so that the cheese is not spoiled. In addition, some studies have shown that the graying of human hair results from a buildup in hydrogen peroxide due to decreasing amounts of catalase in the aging body.
Materials used in the experiment:
-50 mL beaker
-10 mL and 50 mL graduated cylinders
-Fresh 3% Hydrogen Peroxide Solution
-Forceps
-Water pan
-Catalase solution
-Filter Paper, cut into round dots with whole puncher
-Reaction chambers (Drosophila vials with 1- hole stoppers)
-Stopwatch
-Ice
Setting up the experiment:
1. I put a small amount of the catalase solution into the 50-ml beaker
2. I placed four catalase-soaked filter paper disks high on one interior sidewall of the reaction chamber. (They will stick to the sidewall). To prepare a disk for use in the reaction chamber, I held it by its edge with a pair of forceps and dipped it into the catalase solution for a few seconds. I thin drained the disk against the sidewall of the beaker transferring it to the reaction chamber.
Preparing the reaction chamber:
1. I placed the reaction chamber upright and added 10 mL of 3% hydrogen peroxide solution, without allowing it to touch the filter paper disks.
2. I put a stopper in the chamber so that it fit tightly.
3. I filled a pan (almost full) with water.
Conducting the experiment:
1. I laid the 50-mL graduated cylinder on its side in the pan so that it filled completely with water. As an air bubble was present, I carefully worked it out by gently shaking it.
2. I turned the cylinder upside down into an upright position while keeping it filled with water.
3. I carefully placed the reaction chamber and contents on its side in the pan of water, making certain that the side with the disks faced upward.
4. I moved the graduated cylinder into a position so that its mouth came to lie directly over the tip of the stopper. I held it in this position for the duration of the experiment.
5. I rotated the reaction chamber 180 degrees on its side so that the hydrogen peroxide solution came into contact with the catalase-soaked disks.
Recording data:
1. I measured gas levels in the graduated cylinder at 30-second intervals during a 5 minute period.
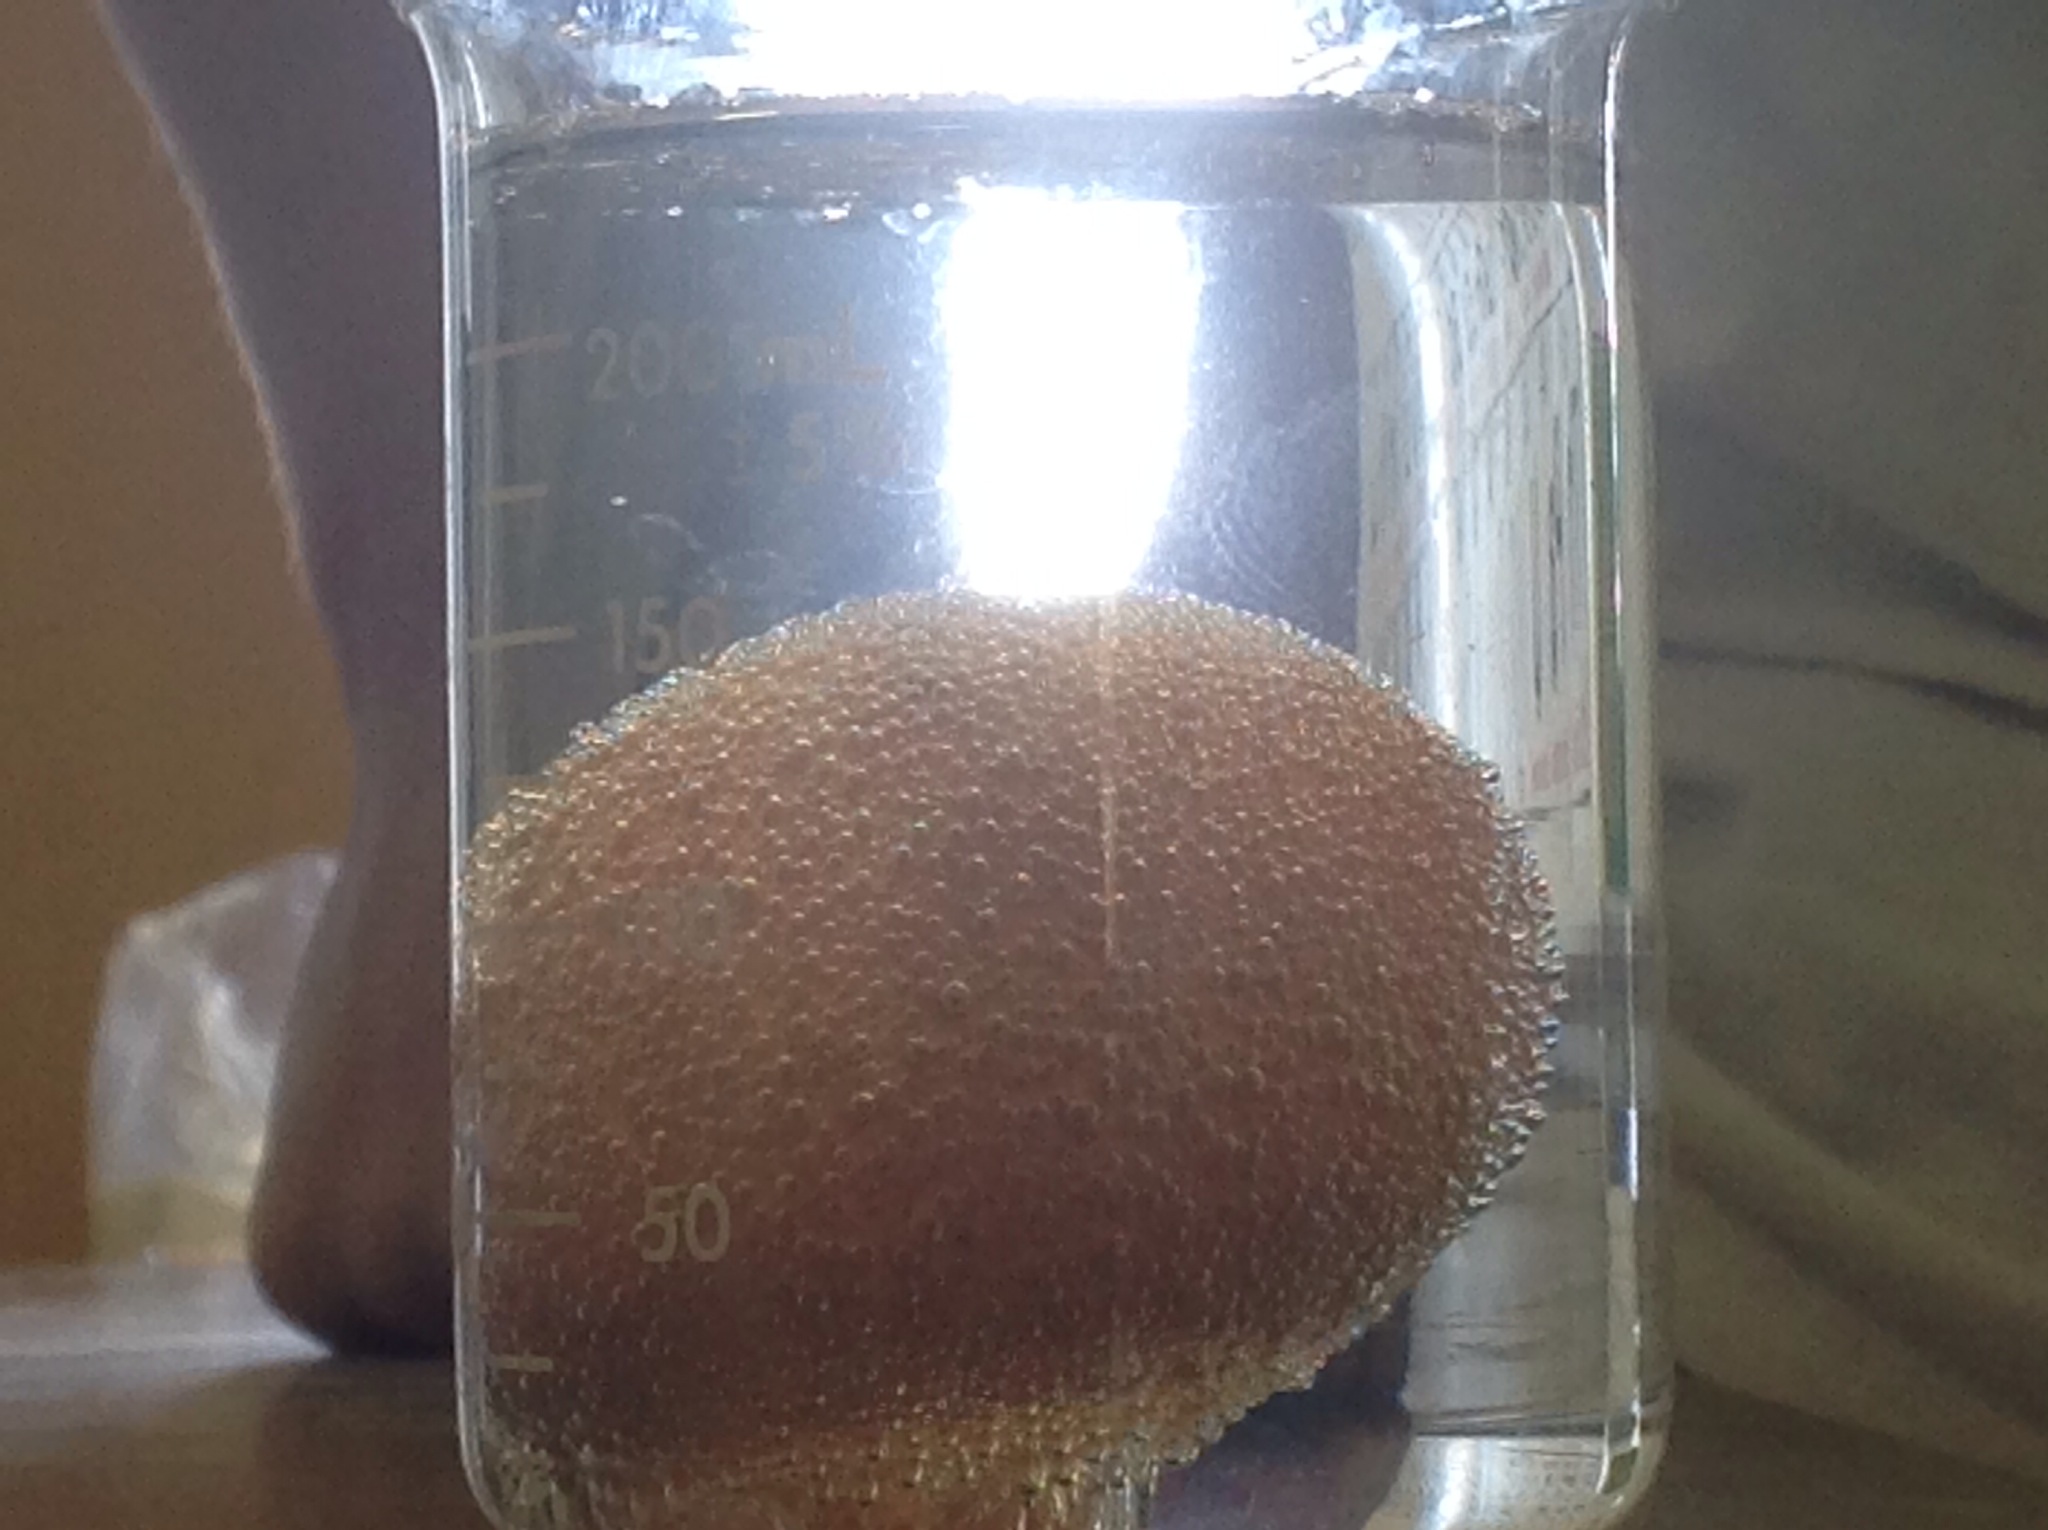
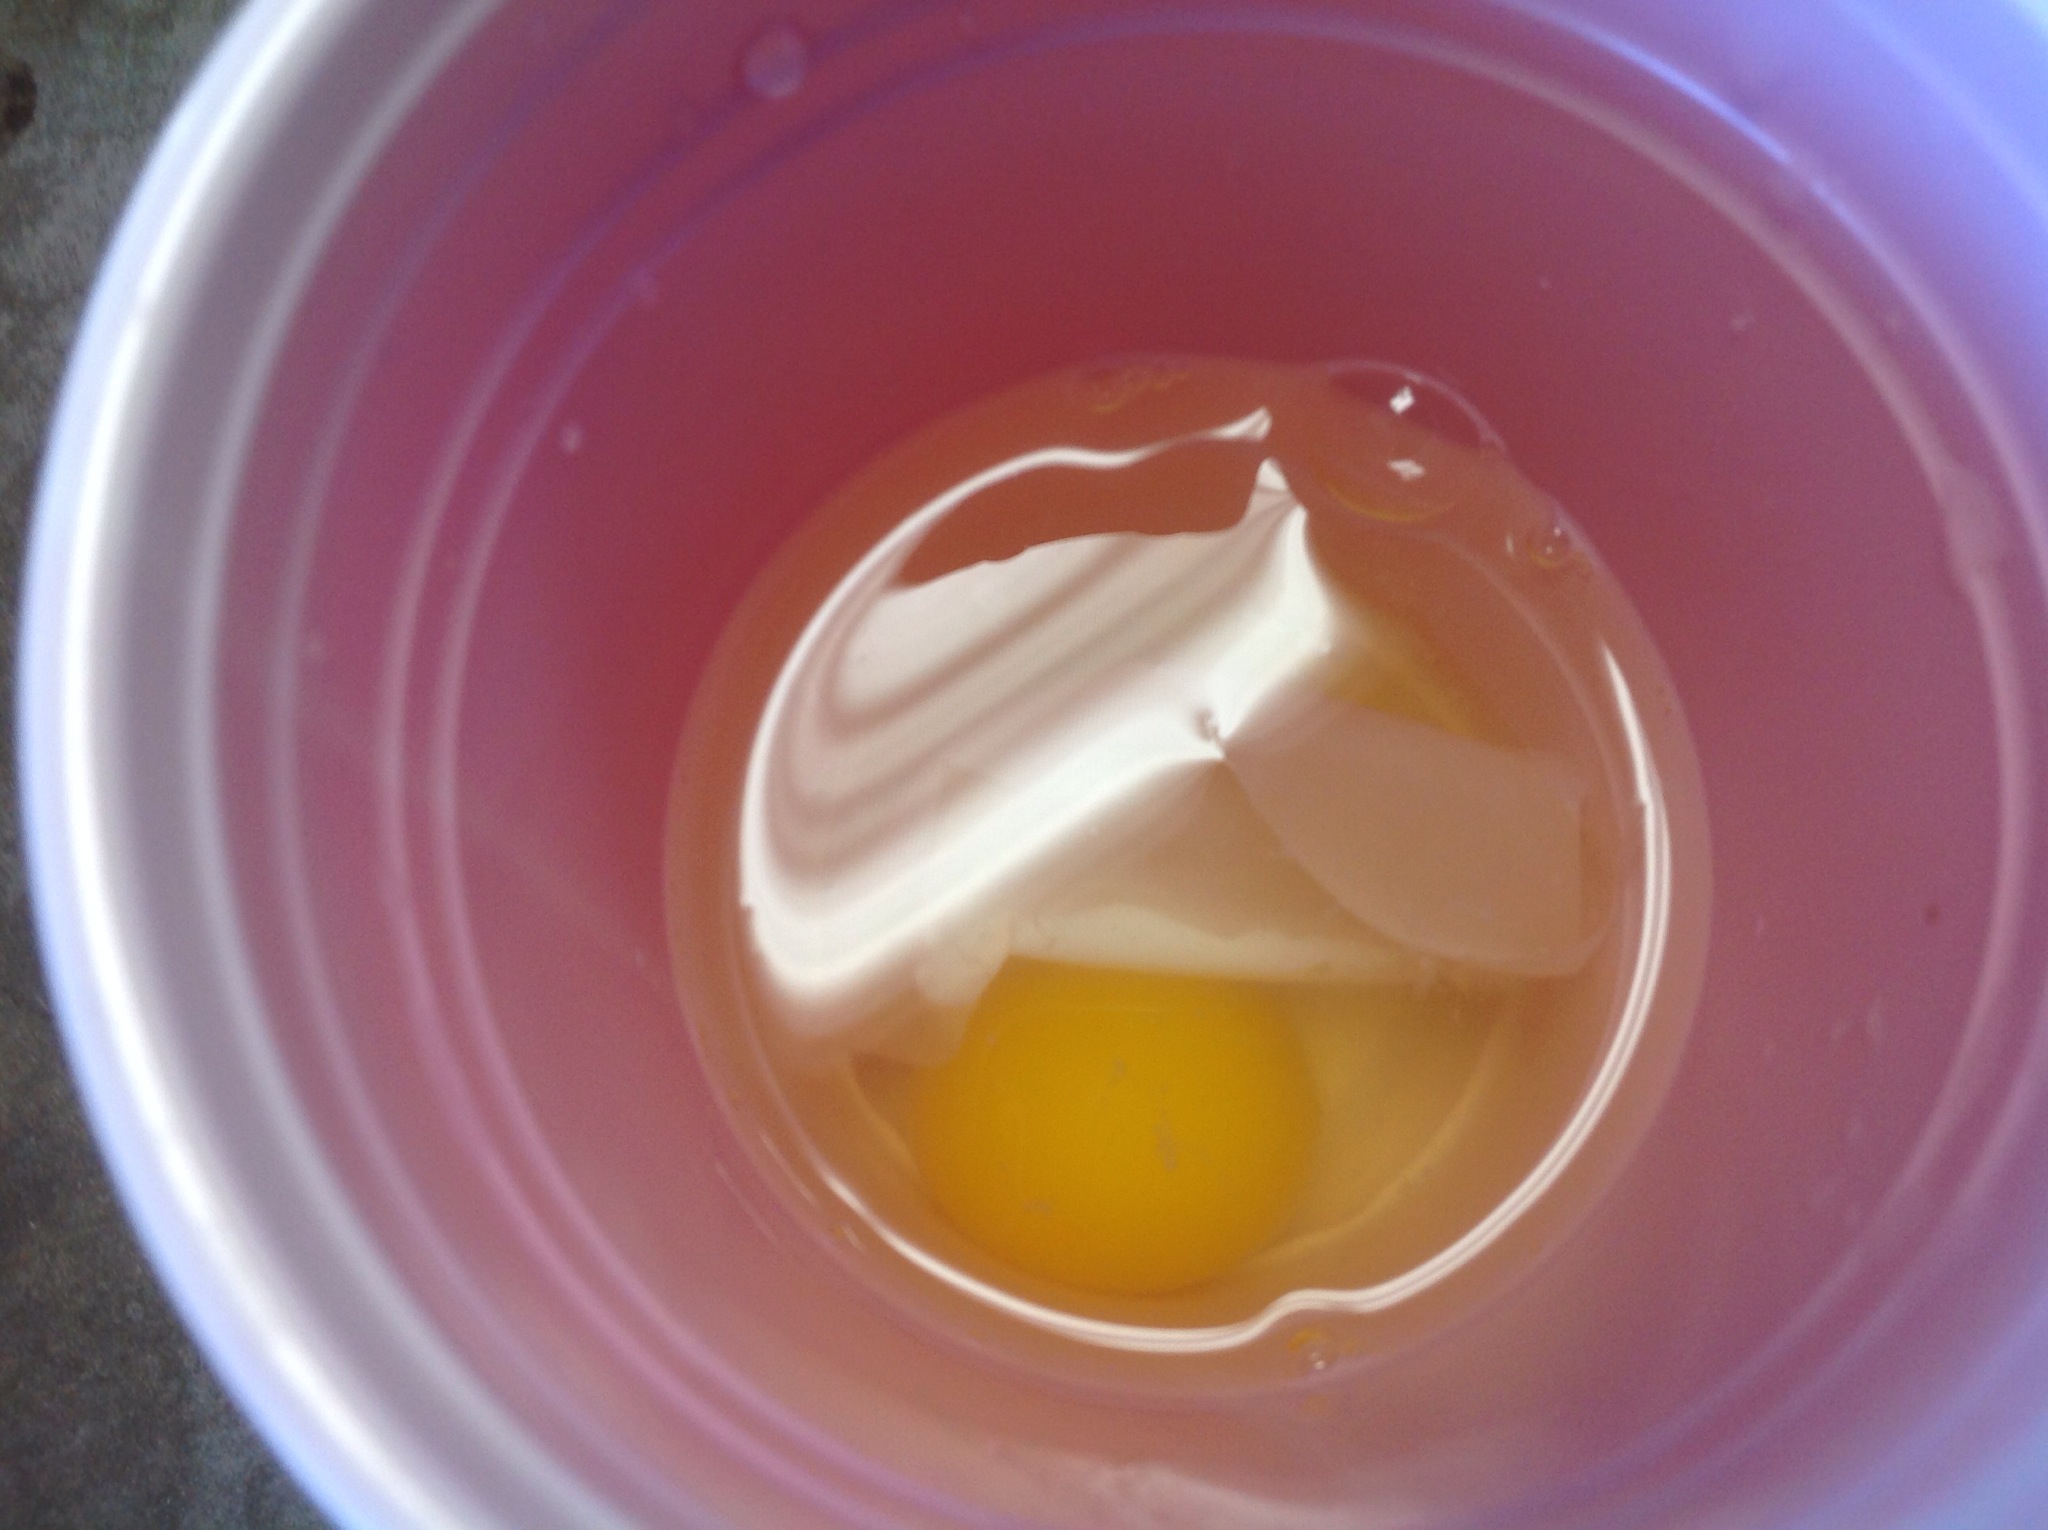
Figure 2
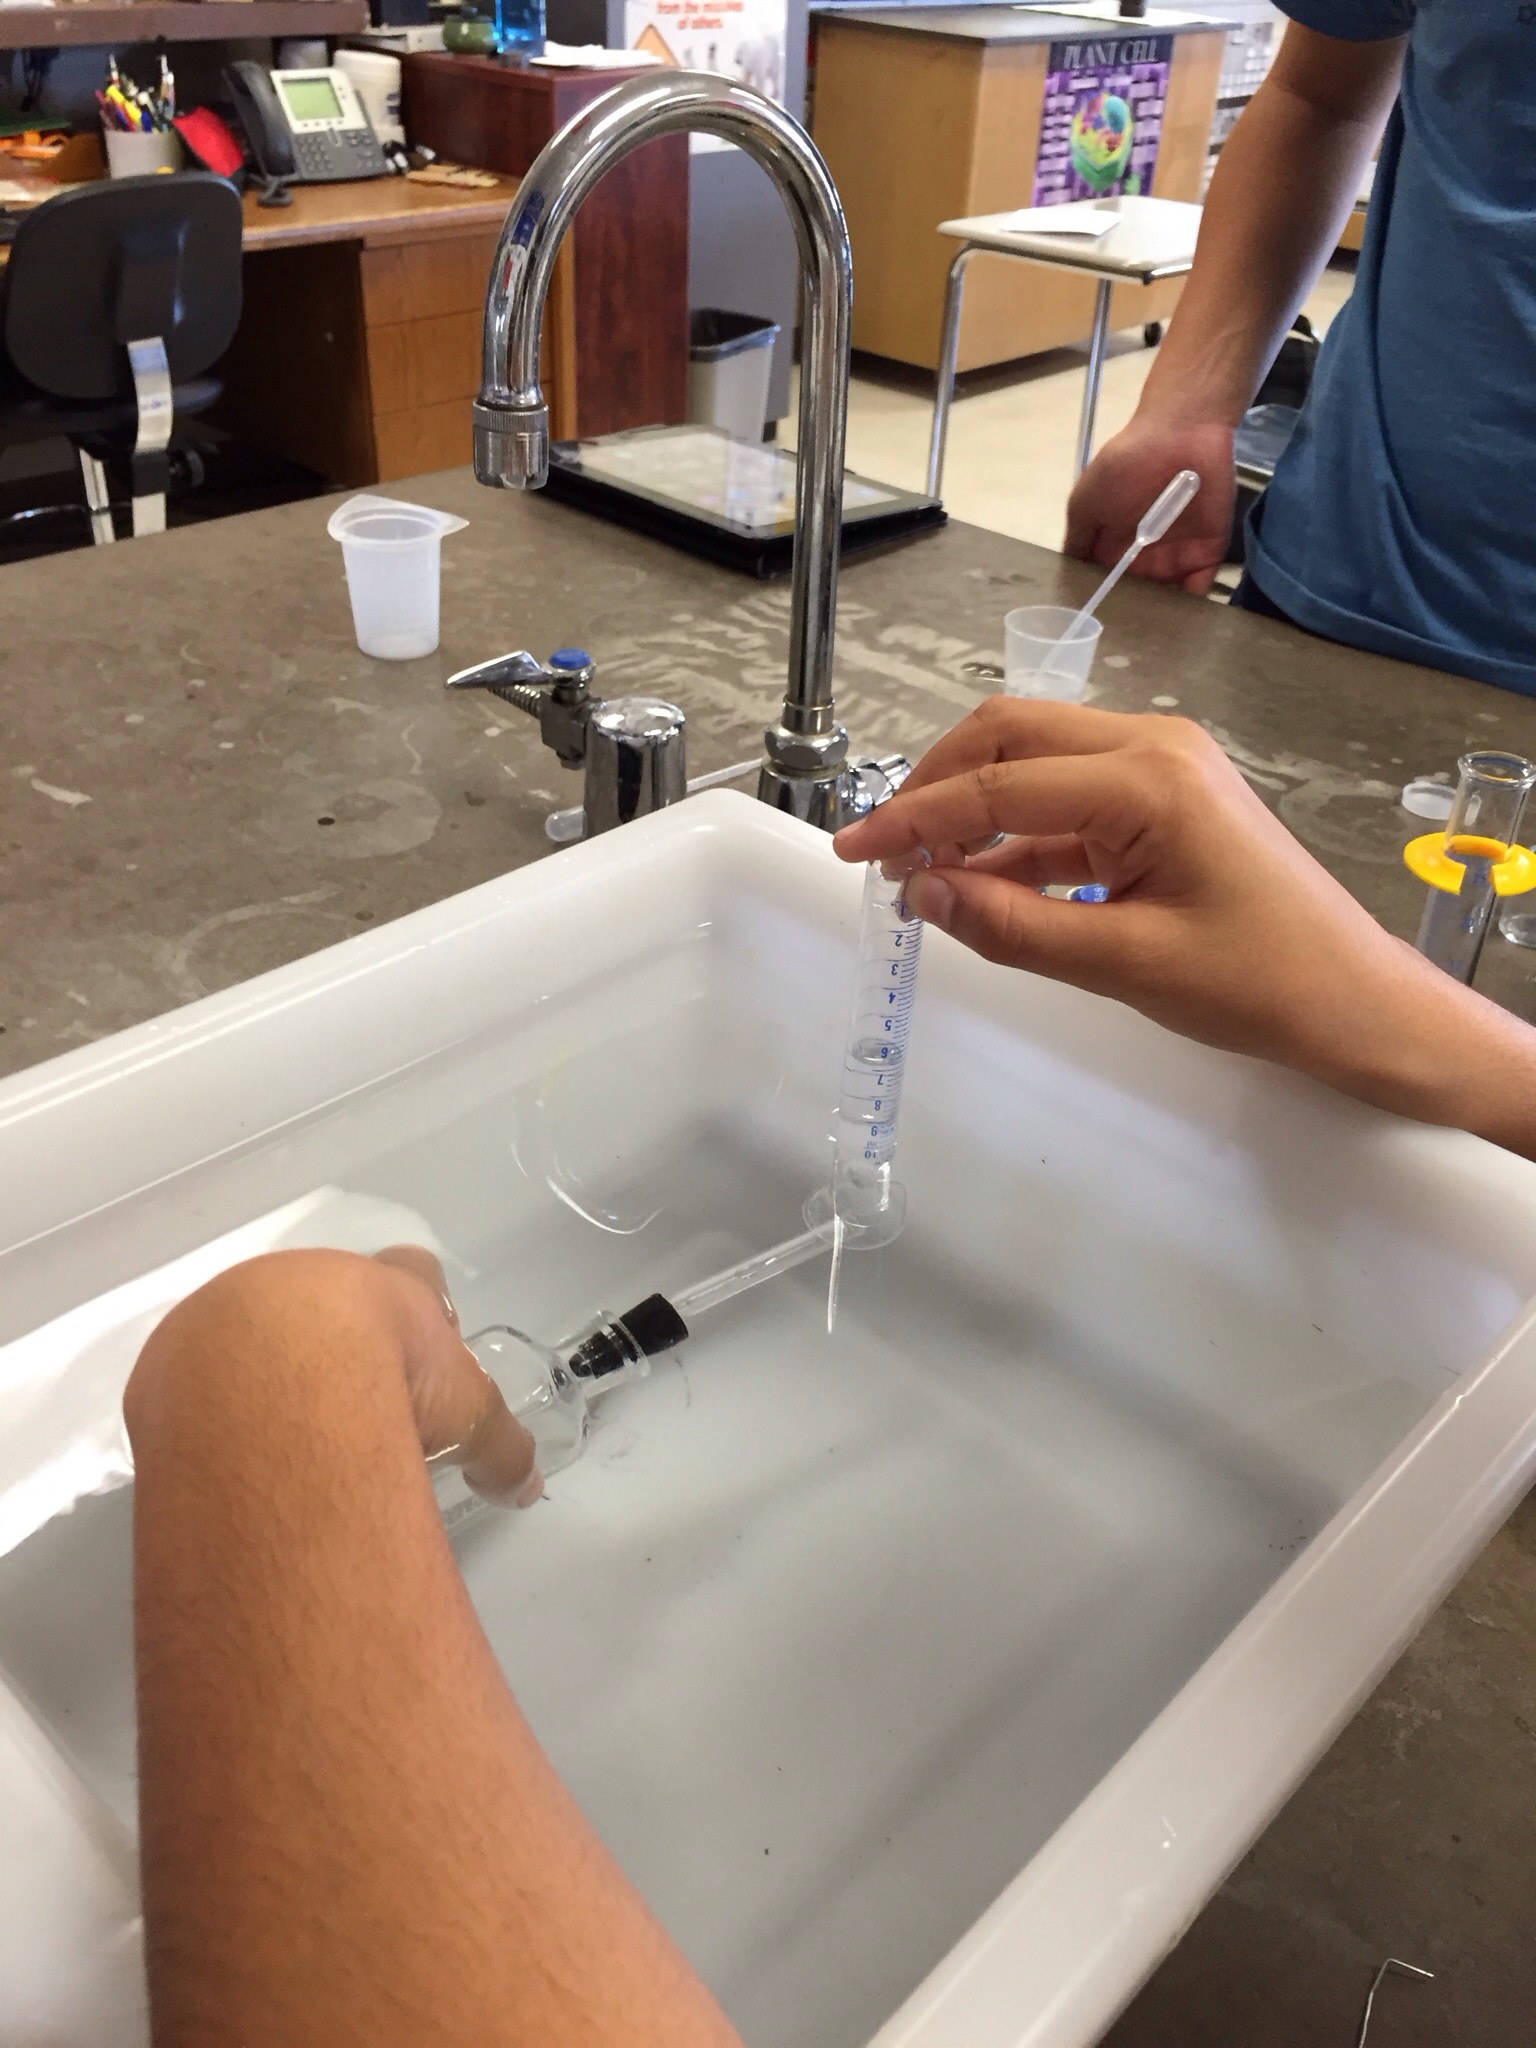
Figure 2 illustrates the production of gas bubbles in the test tube, which rose to form a pocket of gas in the tube.
Figure 3
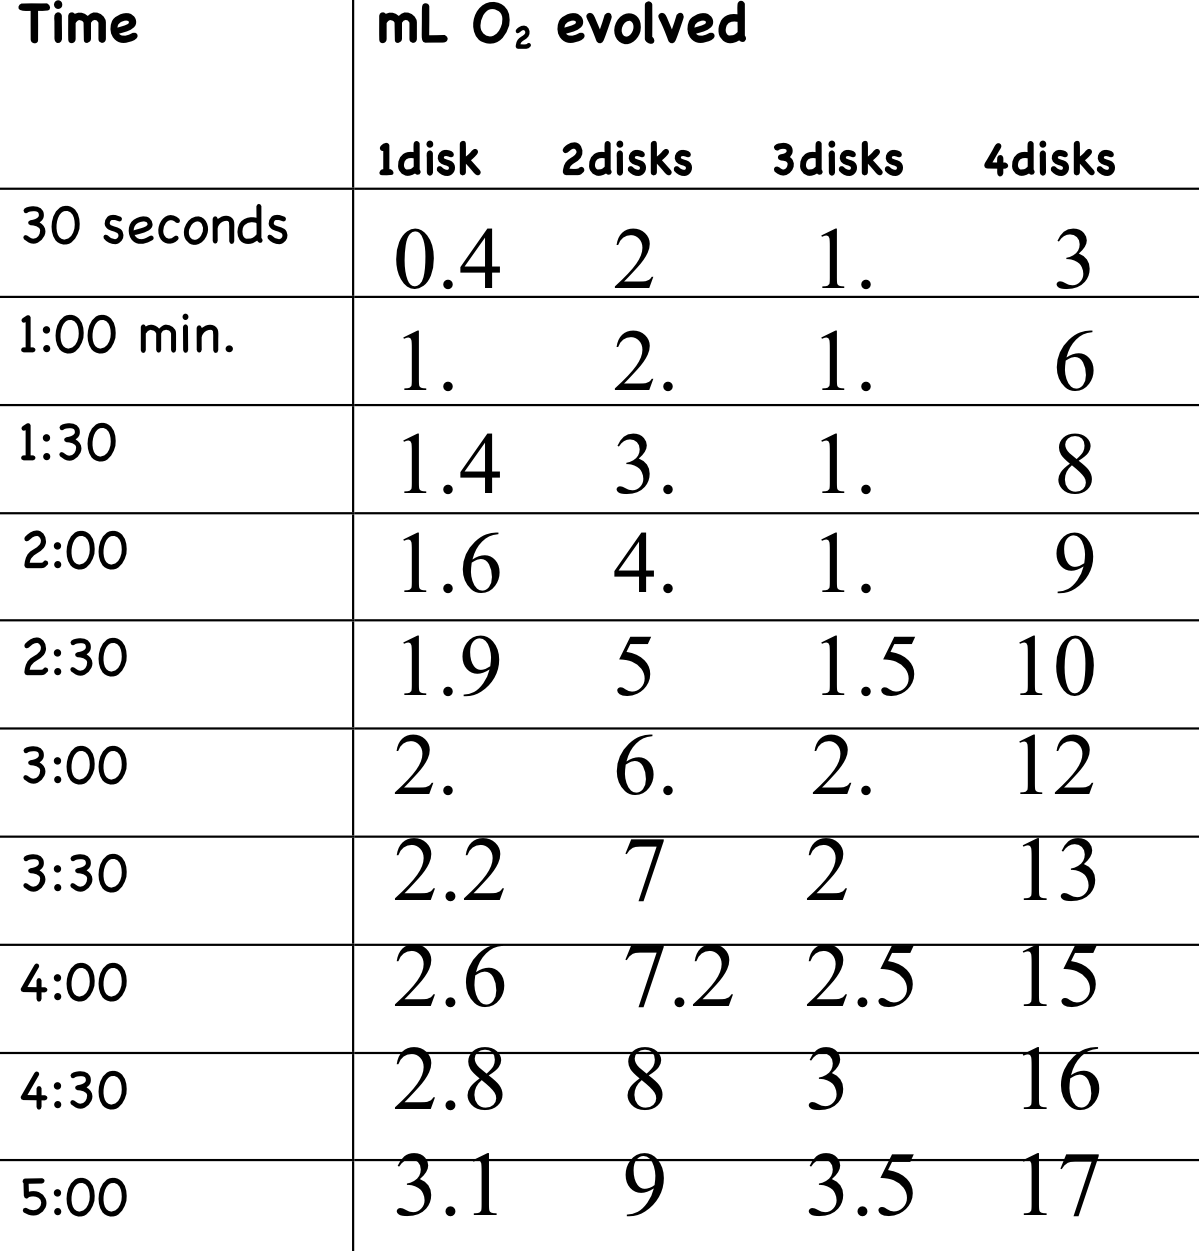
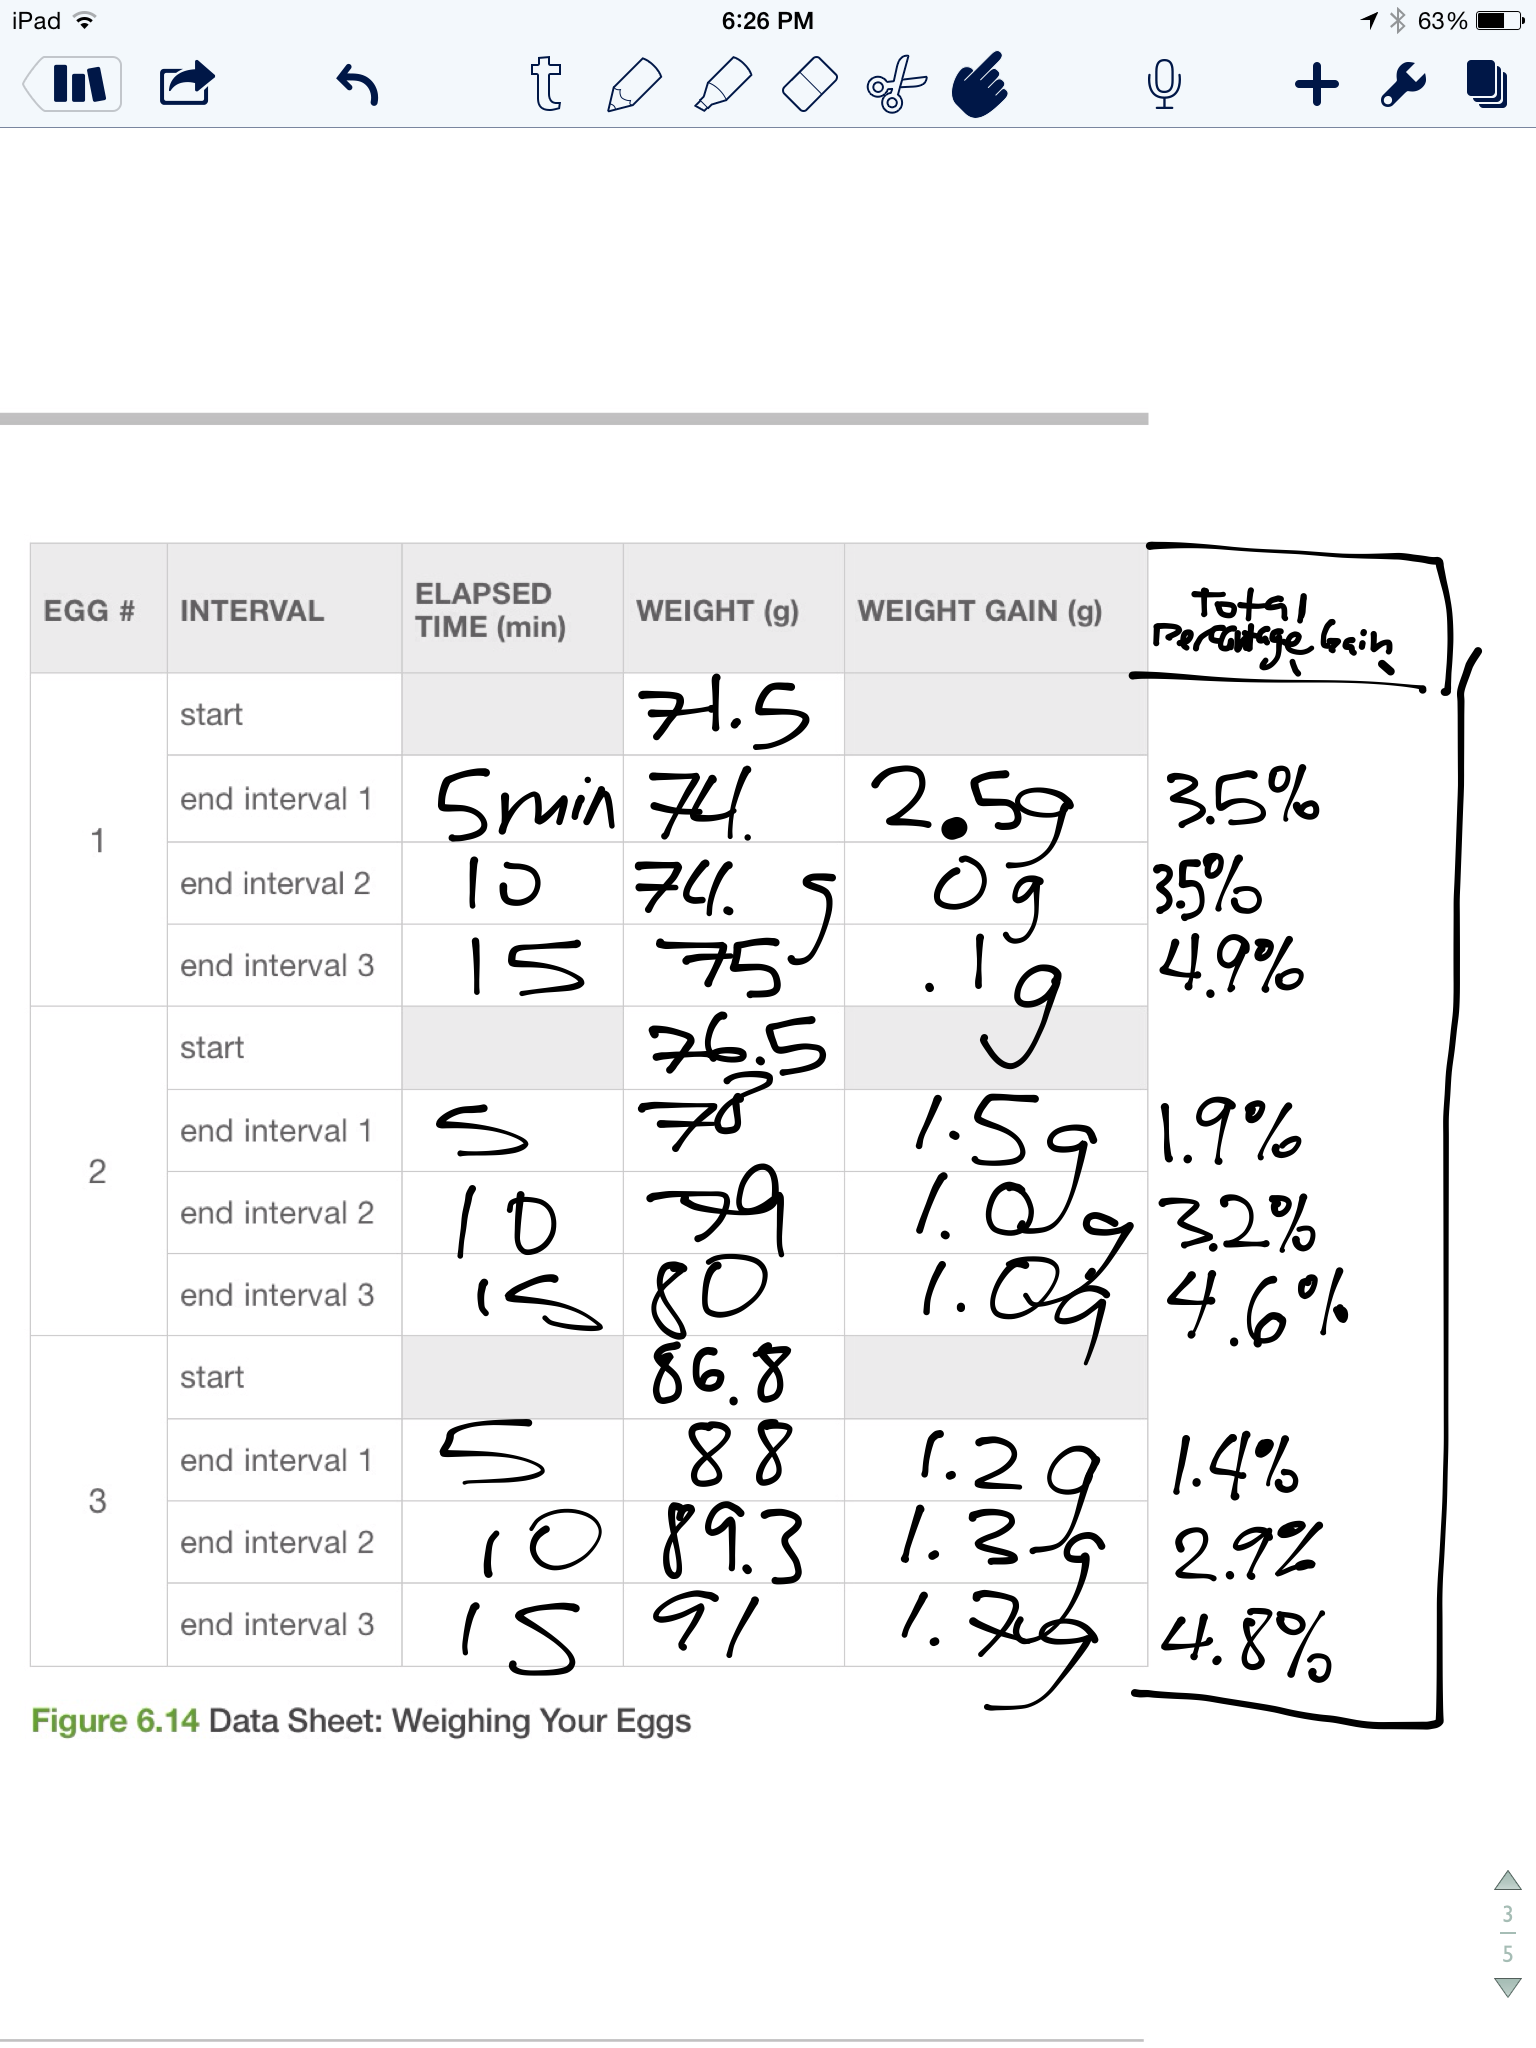
Figure 3 illustrates my table of results for the experiment. From this data, I concluded that when a higher concentration of enzyme is present, the rate of reaction is faster. A notable exception is seen in the discrepancy in the 3 dot category. The one dot solution increased by an average of 0.31 mL per 30 second interval, the two dot solution increased by 0.9 mL every 30 seconds, the three dot solution increased by 0.35 mL every 30 seconds, and the four dot solution increased by 1.7 mL every 30 seconds.
Figure 4
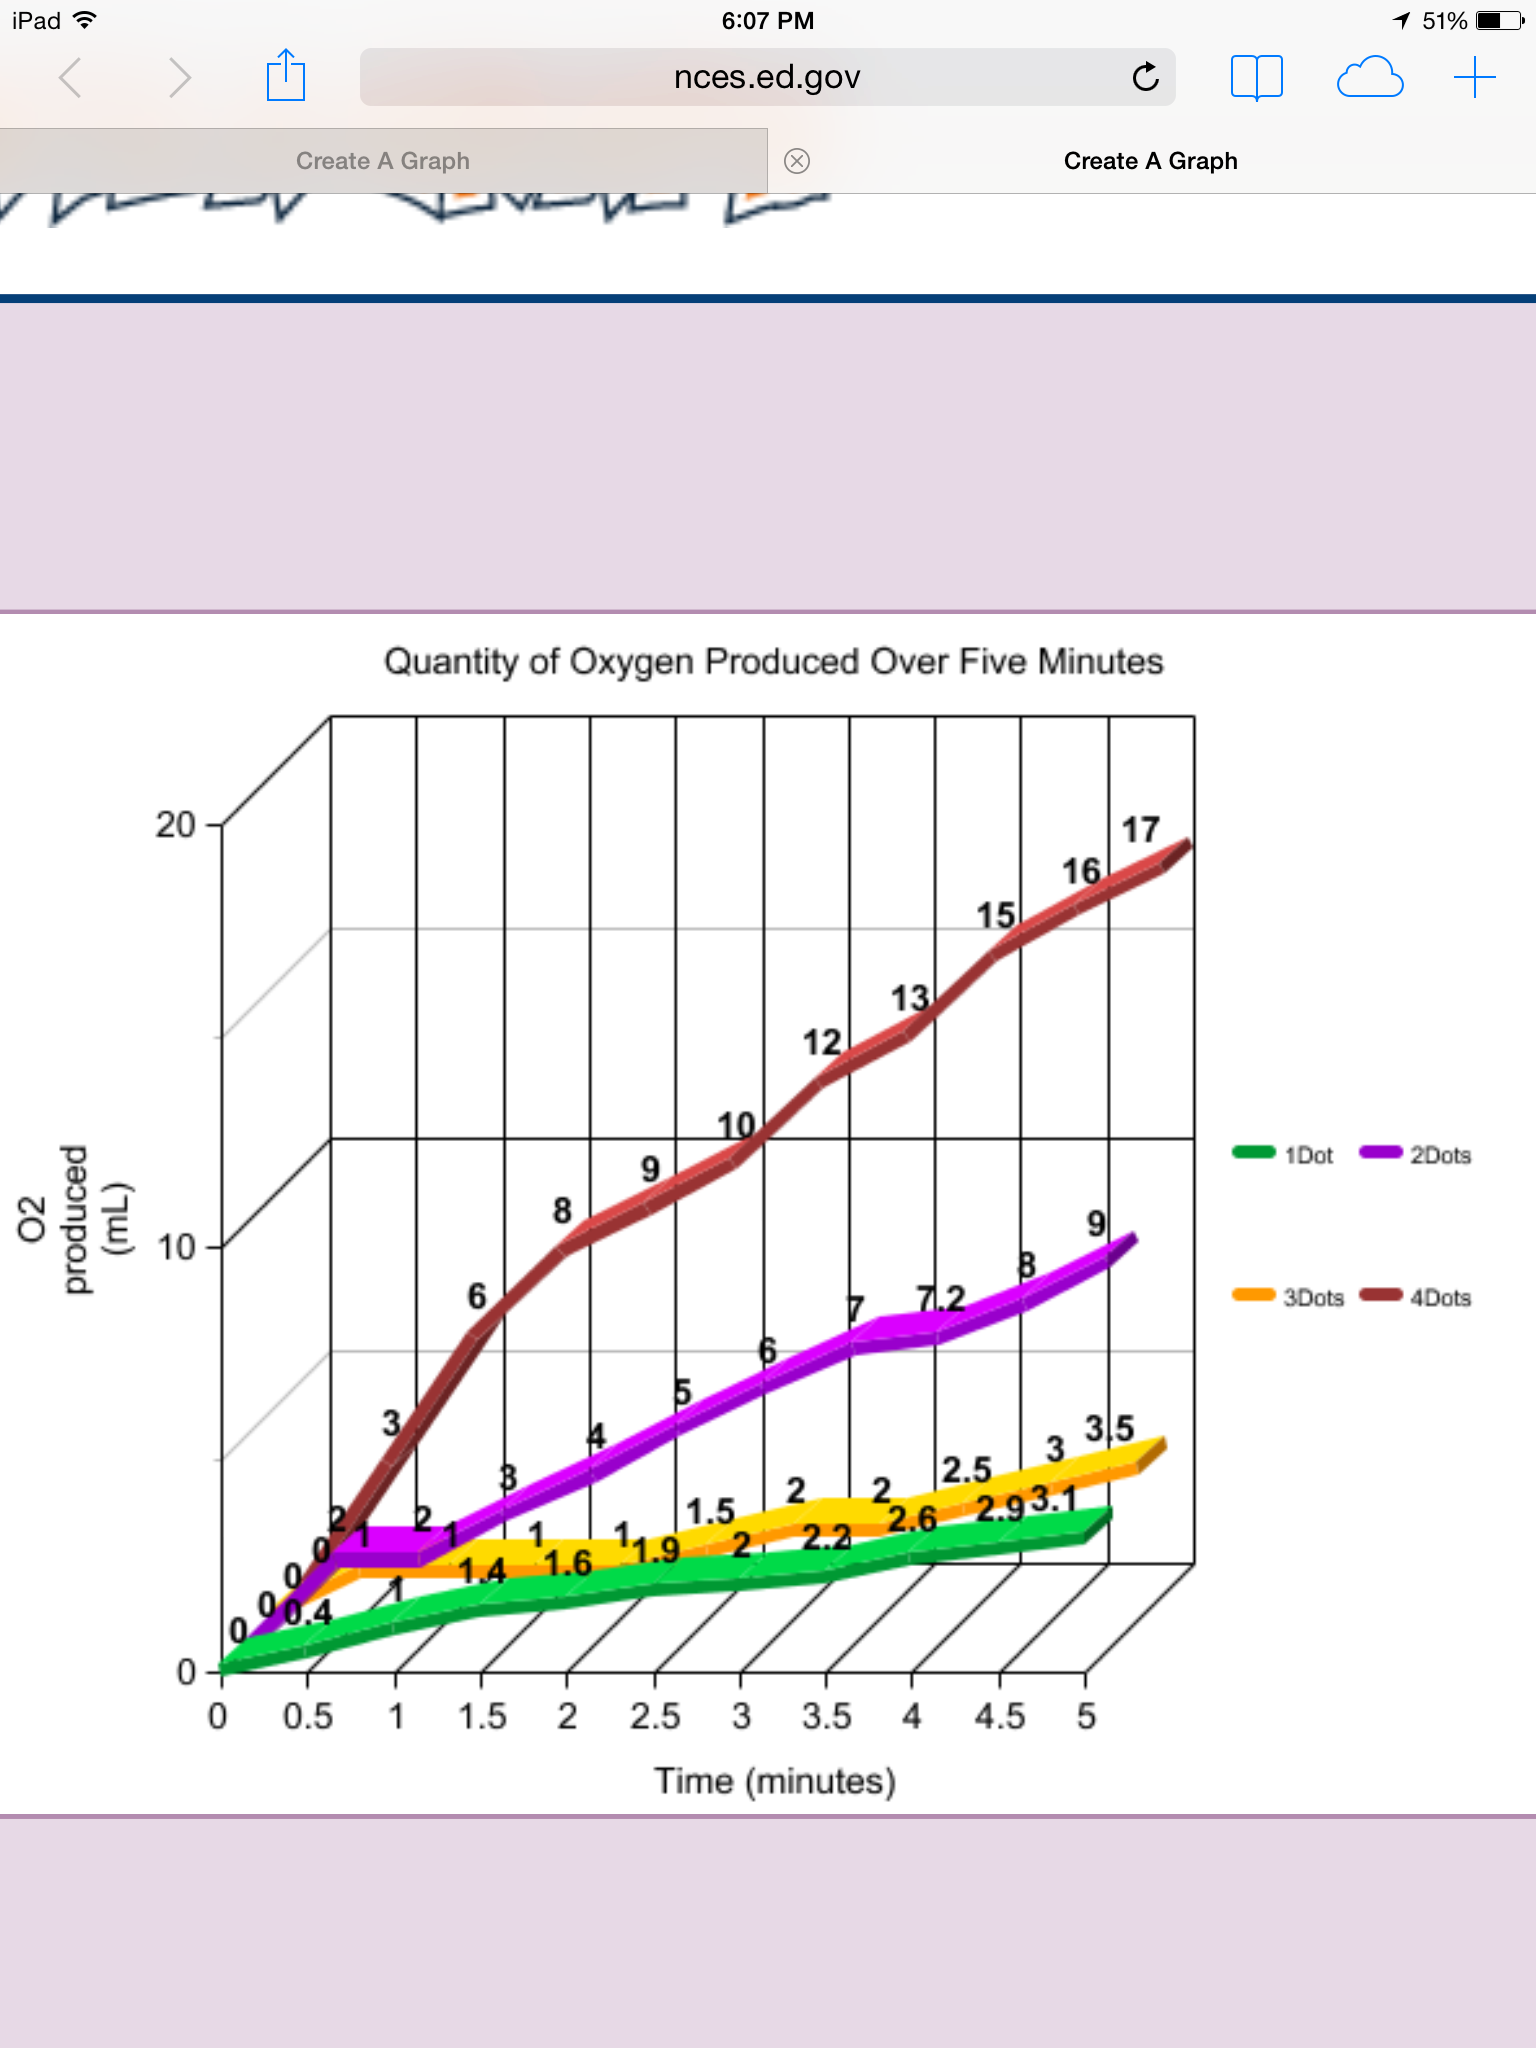
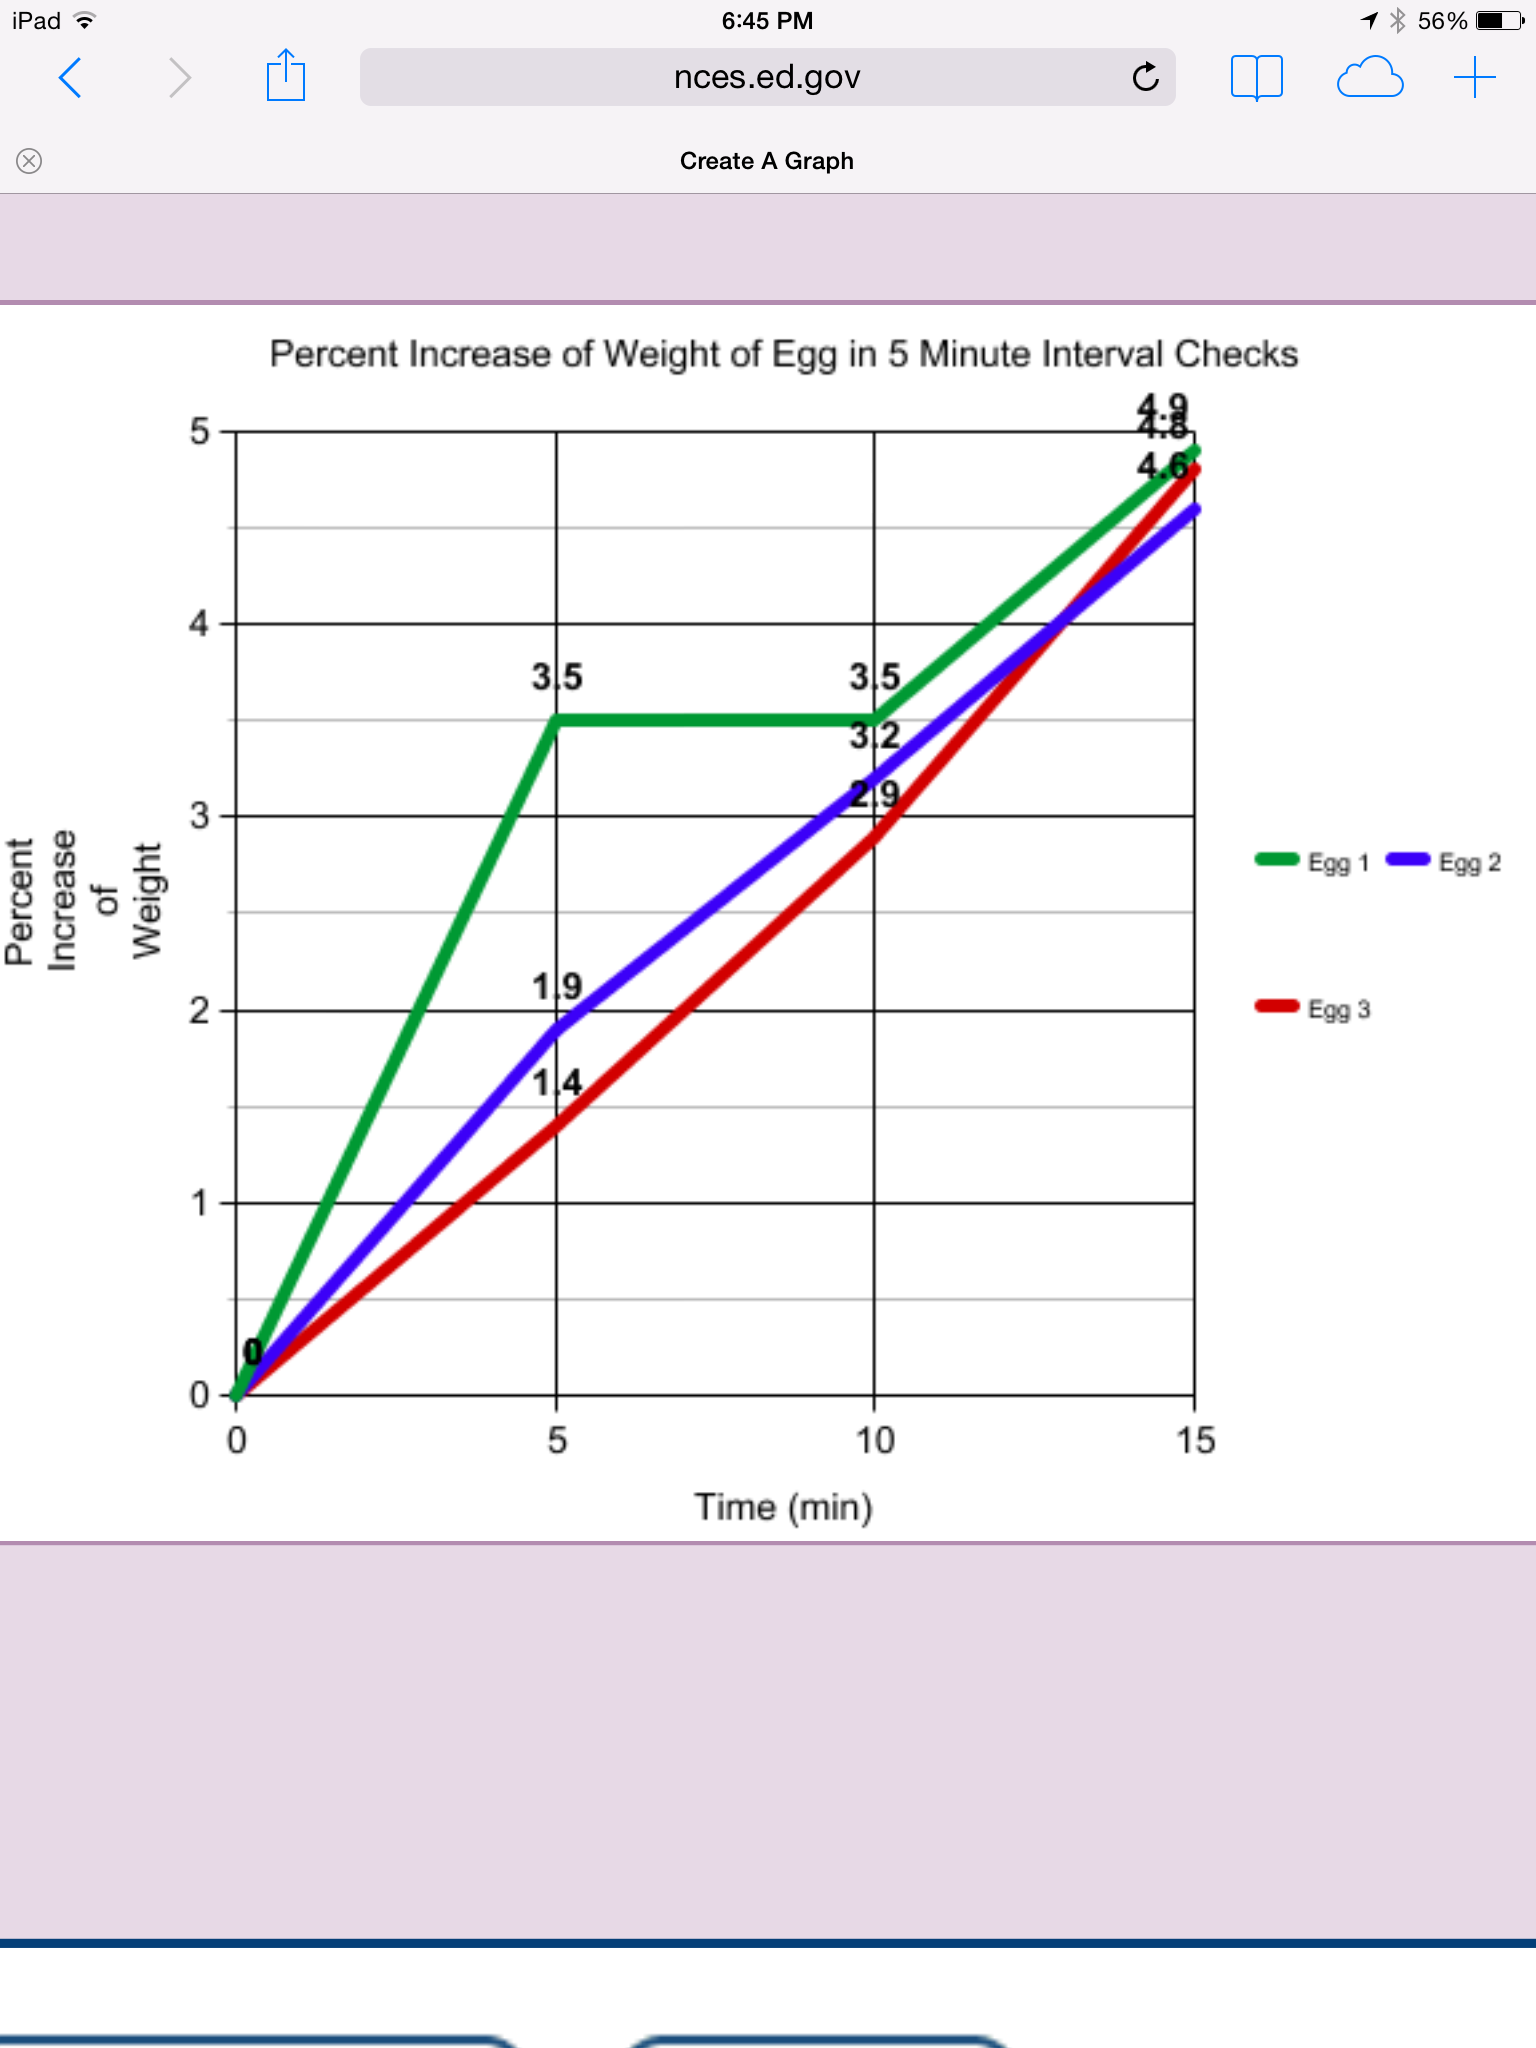
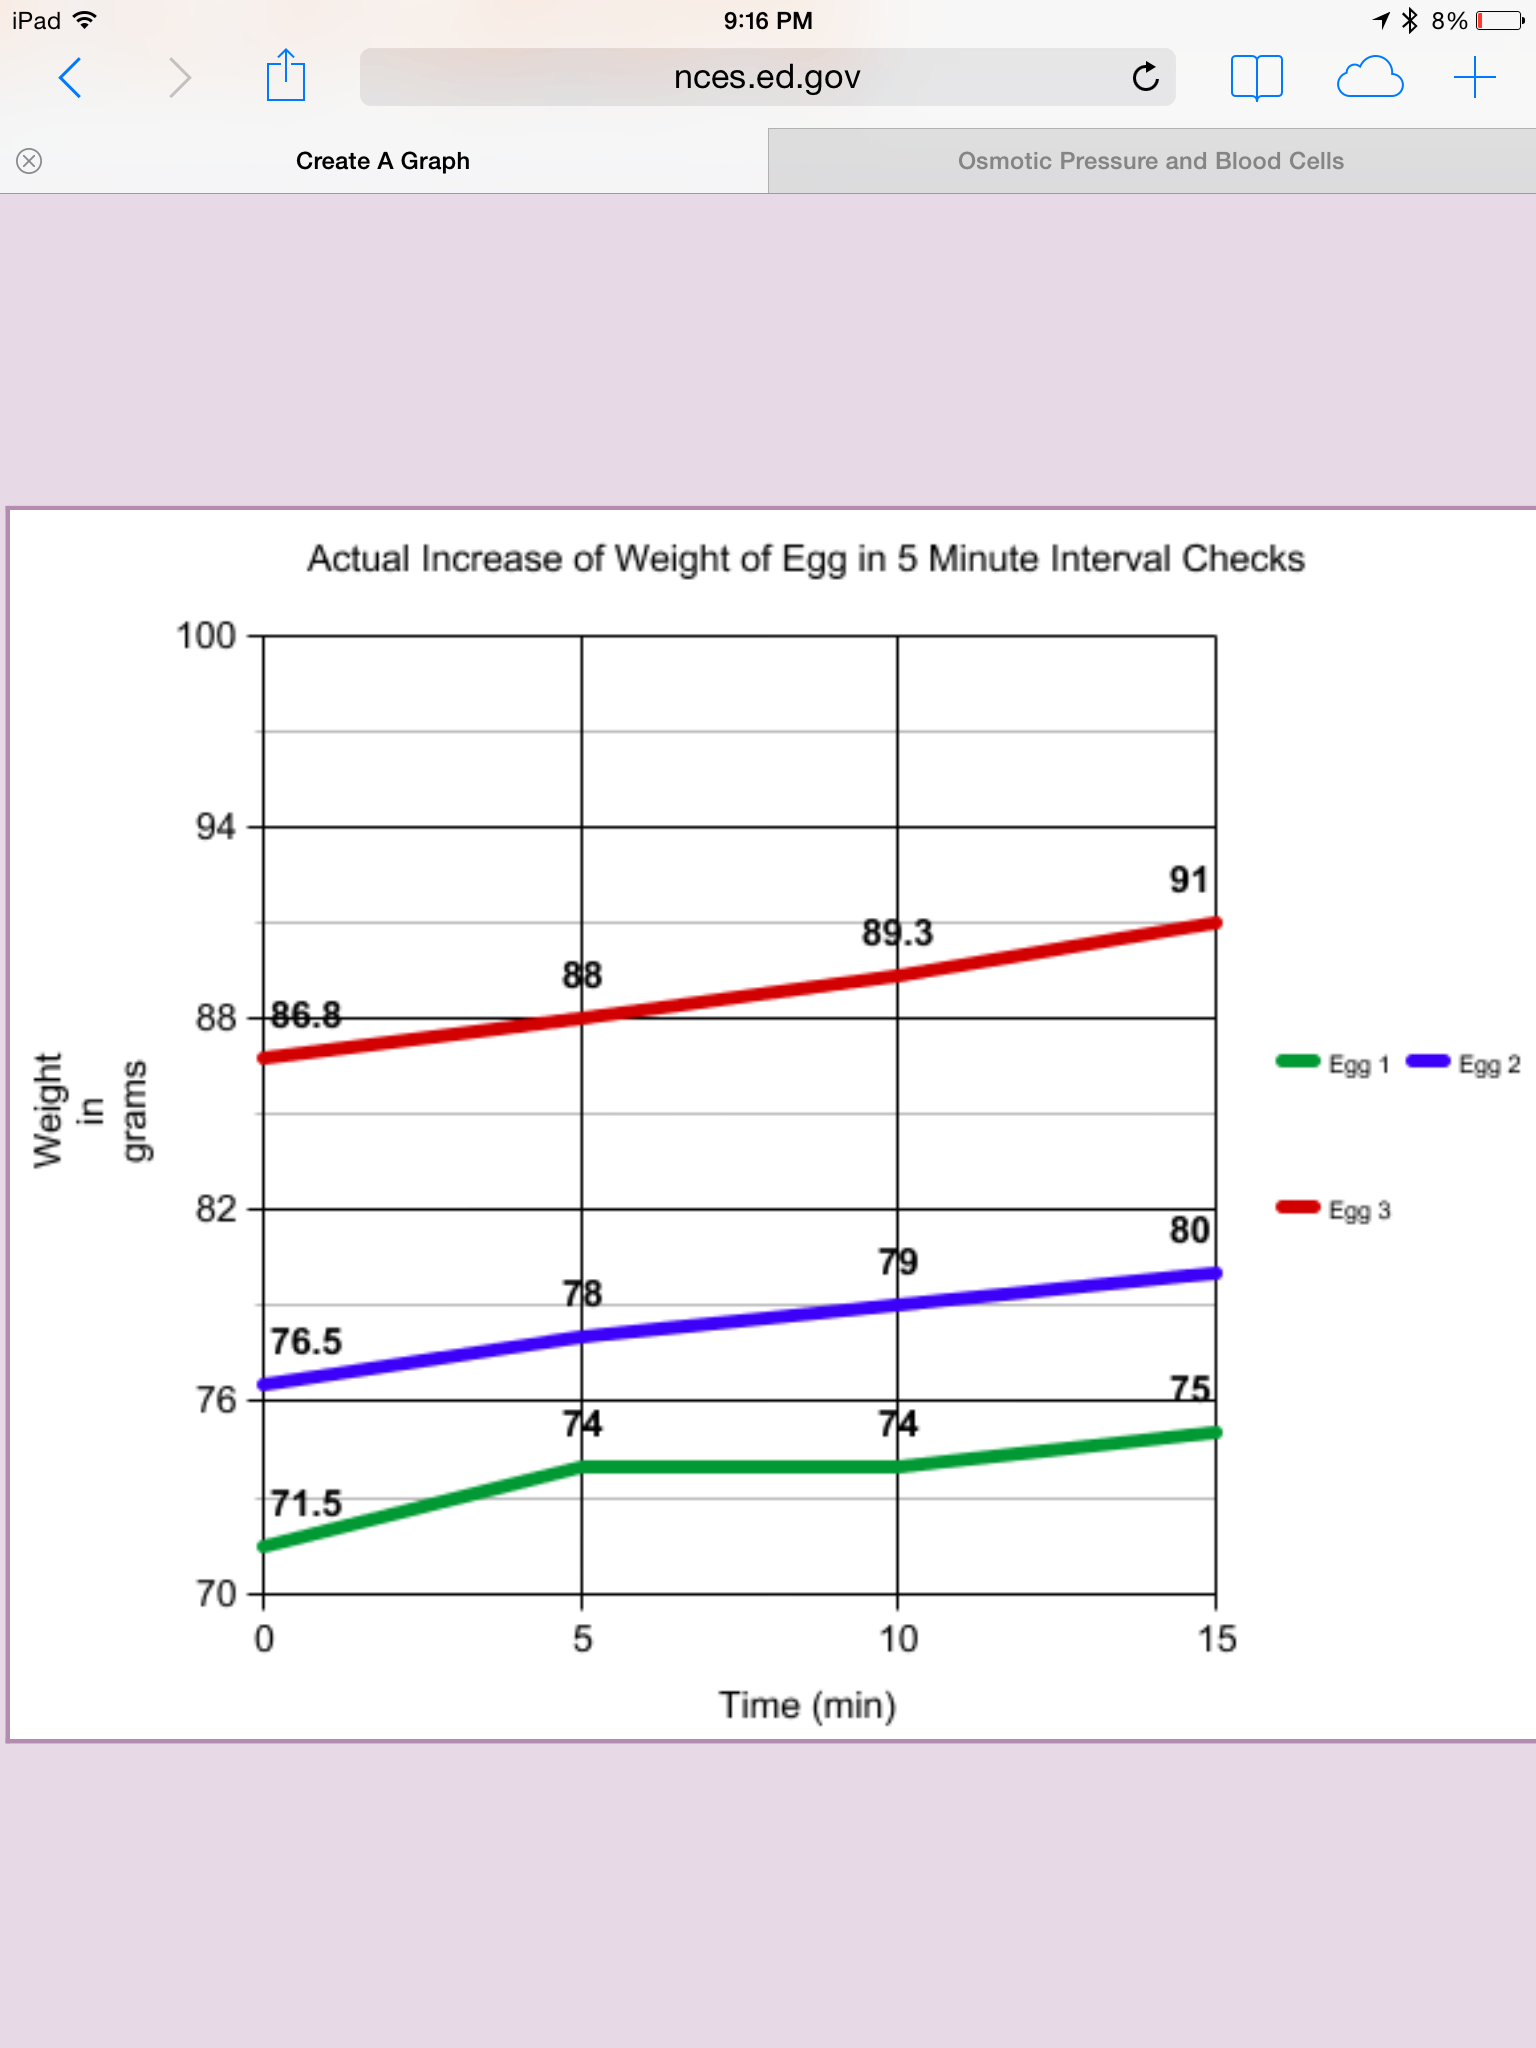
Figure 4 depicts a line graph of the trends of the solutions during the five minute experiment. In general, as noted above, when a higher concentration of enzyme is present, more of the product (oxygen) is produced.
Discussion Questions:
-(Graph Above) Although the amount of oxygen produced eventually slowed down, the action of the catalase remained the same. As catalase is both a reactant and product in the equation (as noted above), the amount of catalase available is constant, and it continued to react with the substrate (hydrogen peroxide) until the substrate was depleted.
-(Table above) Based on the data, I concluded that as the concentration of enzyme increases, so does the quantity of products.
-For optimum enzymatic activity, the surrounding conditions must be set at an appropriate temperature, pH, substrate concentration, and enzyme concentration. Enzymes function well only a specific environment, and within a narrow range of conditions that may vary with the structure of the enzyme. For example, catalase, the enzyme used in this experiment, worked well at room temperature (70 degrees), in water (pH 7), and in a solution in which the available substrate exceeded the active sites on the enzyme.
In this experiment, I studied the effects of the quantity of catalase on enzymatic activity. I proved that my hypothesis was correct, as my data reveals that when a greater concentration of an enzyme is present, a larger amount of products are produced. This is because the greater quantity of enzyme provided more active sites with which the substrate could react, which resulted in a higher probability of a successful reaction. This can be visualized in the following figures:
Figure 5
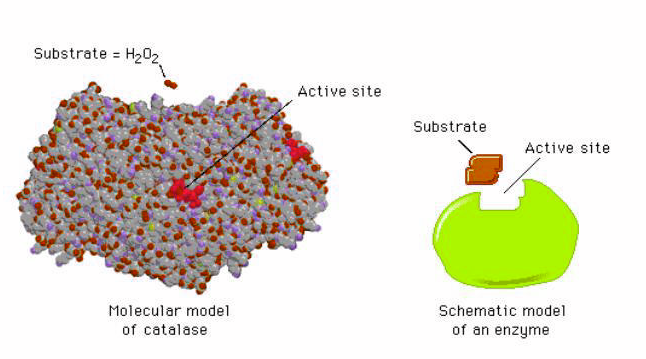
Figure 6
As illustrated in Figure 4, the four dot solution produced the most oxygen (17 mL after five minutes), followed by the two dot solution (9 mL after 5 minutes), the three dot solution (3.5 mL after 5 minutes), and the one dot solution (3.1 mL after 5 minutes).
Of note, there was an unanticipated result in the three dot solution, as less oxygen was produced than was expected. The amount of oxygen visible during the reaction produced in that reaction remained constant; however, some of the gas was inadvertently not captured in the test tube due to human error. In addition, one of the dots in that solution was not completely soaked in catalase, which likely affected the results by reducing the amount of enzyme available to facilitate the breakdown of hydrogen peroxide.
If I were to repeat the experiment, I would position the test tube so that all of the oxygen is collected. I would also vary the ambient temperature, pH, and salinity in order to determine the effect of changing those variables on the activity of catalase. I would also determine the effect of a competitive inhibitor of catalase on the rate of decomposition of hydrogen peroxide. An interesting potential application of catalase is to restore natural hair pigments, as white hair may result from an increase in hydrogen peroxide in aging hair follicles, and exogenous catalase might reverse pigment degradation. Catalase may also have a role in cancer treatment, as tumor cells could be targeted with a chemical inhibitor of catalase, which might allow naturally produced hydrogen peroxide to preferentially destroy those cells.
http://www.sciencedaily.com/releases/2009/02/090223131123.htm
http://www.princeton.edu/~achaney/tvme/wiki100k/docs/Catalase.html